New transportation infrastructure solutions need to consider whether they can sustain the needs of the different stakeholders and ensure public acceptability. A critical component that influences public support is the equity of these solutions and whether they will continuously meet the satisfaction of all stakeholders. Equity is a growing social consideration that is a lawful and ethical practice and is considered a global concern across all transportation systems. Different demographic sectors face systematic barriers to accessing transport facilities, including regressive transport costs, housing on the urban periphery with poor public transport access, lack of road safety and absence of network connectivity. Governing bodies should address those vulnerable to inequitable transport impacts to provide inclusive and sustainable local transport facilities. This is widely supported by the 11th Envision 2030 sustainable development goal (SDG) of “Sustainable Cities and Communities”. This policy brief calls for (i) ranking transport network structure (connectivity, density, accessibility, etc.) of Group of 20 (G20) cities, (ii) defining a consistent terminology for equity, (iii) measuring equity impacts for any new large-scale infrastructure projects at the design stage, (iv) consistent mechanisms to capture the travel patterns in G20 and worldwide cities.
Challenge
Less than a decade remains in achieving the United Nations 2030 Sustainable Development Agenda. The prevailing implications of the COVID-19 pandemic onsets the urgency to accelerate action on the already impeded Sustainable Development Goals (SDGs). In 2020, an additional 120 million people across the globe fell into extreme poverty. Recognising the need to make significant strides towards the 2030 goal, involved countries must make a genuine effort in areas where deep-rooted systematic inequities divulge the synergy between economic, social and environmental dimensions of global sustainable development. This also means ensuring that on a national and local level, “no one gets left behind”. This places a strong emphasis on the consideration of equity and the need to enforce fair and impartial practices both within a country and between developed and developing nations.
Effective transport planning is vital to provide the necessary connectivity, trade, economic growth and productivity that drive an interactive and dynamic society. On a local level, transport solutions should be evaluated through equity parameters and impact-distribution analysis. Careful considerations within this field of study are pivotal in making meaningful decisions within transport planning. It is heavily assumed that most executive practitioners and public decision-makers sincerely practice achieving equity objectives (Martens 2016). Governments have the fundamental duty to provide every person with adequate transportation and mitigate the systematic social disparities generated from past decades. This perspective aligns with the advice mentioned above by the UN and further applies this ideology to local transport infrastructure. Again, while there is no “one-fits-all” solution to solve inequities in different global contexts, governments also have no single standard to evaluate transportation equity across their local areas.
A significant contributor to inequity within the cities is urban congestion. Discounting the unprecedented period of the COVID-19 pandemic, TomTom had reported that nearly 75 percent of recorded cities experienced increased or stagnant congestion levels between 2017 and 2018. Causes of urban congestion can either be generated from demand-side pressure or the lack of supply-side road capacity and inadequate traffic management. Investigating ways to reduce the impact of traffic congestion will be increasingly important, as the proportion of the global population living in urban areas has increased from 51.1 percent in 2009 to 55.7 percent in 2019 (UNCTAD, 2020) and is projected to increase to 68 percent by 2050. Urbanisation is higher in developed (80.5 percent in 2019) than in developing countries (51.1 percent). Traffic congestion is estimated to cost around US$88 billion per year in the United States, £6.9 billion in the United Kingdom and €2.8 billion in Germany (INRIX, 2020). The cost comes from vehicle delays, lost productivity, travel time variability, fuel consumption and air pollution impacting health costs. Reducing urbanisation, and consequently, traffic congestion has been a challenging task and will continue to be so in the immediate future because of the rapid, complex and heterogeneous manner of urban expansion (Strano et al., 2012).
Transport planners and policymakers can manage road demand and supply functions to address the growing concerns relating to congestion, noting there can be a disconnect between planning and political decision making. On the supply side, road authorities can enhance capacity constraints through better public transport, connectivity, improving road capacity and better traffic management through intelligent transport systems (ITS), within fiscal constraints. Alternatively, travel demand can be reduced by encouraging remote working and telecommunications, and incentives to shift modes and/or departure times. TomTom (2020) had seen 387 cities experience traffic congestion decrease since 2019, with working from home practices spearheading reductions in congestion levels during AM and PM rush hours during the COVID-19 pandemic. That said this can affect the viability of sunk public transport investment costs, as previous patterns of capacity catered for a strong morning peak profile. Additionally, congestion pricing offers another approach to reducing road demand through variable tolls and parking levies. However, the latter may incur an inequitable distribution of impacts dividing the financially advantaged and disadvantaged, and it is politically difficult to sell in democracies.
Nevertheless, most of the infrastructure solutions (either on the supply or demand side) have been ad hoc, leading to inequalities in benefits across the demographics. This is a likely consequence of the political dynamic in constituencies overriding coordinated planning. There is no consensus on what constitutes equity and therefore, different terminology being used is not coherent. Road network structure (connectivity, layout, density, accessibility, etc.) is one crucial factor that has not been explored adequately in the context of equity and congestion, although it plays a crucial role in the spatial organisation and evolution of cities and the complex and dynamic processes occurring on them. Evaluating equity with respect to traffic characteristics in multiple cities at once and being able to compare and contrast has been challenging since it is reliant on access to efficient and accurate travel demand data that is also consistent.
Proposal
Quantifying road network structure
Most of the past studies on traffic congestion have focussed on the implications of specific factors such as adverse weather, driving behaviour, on-street parking and bus stops. The study areas have been confined mostly to intersections, freeways and city networks. However, there are only a handful of studies on evaluating and comparing the congestion levels for different cities across the world (Liao et al., 2020; Nair et al., 2019). The road network structure is a crucial factor that has not been studied adequately in the context of traffic congestion, although it plays a crucial role in the spatial organisation and evolution of cities and the complex and dynamic processes occurring in them (Strano et al., 2012).
Network structure, in this context, refers to the quantitative measurement of the layout, arrangement and connectivity of the road network (Parthasarathi et al., 2013). Road networks are shaped by a city’s age, terrain, economy and, most importantly, city planning. Before the invention of automobiles, the conventional grid network was recognised as the most effective arrangement for accessibility and use of space. Large-scale urban planning was only introduced less than 100 years ago, compared with the time scale of historical city growth of thousands of years. These days, most street networks are complex, i.e. the topology is neither entirely regular nor random (Boeing, 2017). They may appear to be disordered structures, yet patterns and connections can still be found.
In the late 20th century, most studies focussed on a coarse representation of easily measured metrics of the transportation network such as the density of the road network, the number of three-way or four-way intersections, cul-de-sacs, or the length of street network on travel behaviour (Parthasarathi et al., 2012). In the early 2000s there were numerous studies on the application of network metrics on characterising the structural properties of road networks such as degree distribution, betweenness centrality, scaling properties, small-world properties, the evolution of networks, street configuration, etc. Only a handful of studies have explored the relationship between the aggregated network metrics and travel attributes such as accessibility, traffic flow, traffic mix, mixed usage of kerbside, safety, mode share, trip distances, travel times, etc. A quick summary of a selection of studies is provided in Table 1.
Table 1 Summary of selected literature on the impact of road network structure on traffic and safety attributes
| Authors | Study focus | Key network metrics | Relation of network metrics with travel attributes | Data |
| (Jiang 2009) | Traffic flow | Page rank | Page rank is strongly correlated with pedestrian and vehicle flow on a link | Pedestrian and vehicle movement data of central London |
| (Levinson and El-Geneidy 2009) | Journey to work | Circuity |
| Journey to work data from 20 metropolitan regions in the US. |
| (Marshall and Garrick 2011) | Road safety |
|
| Crash records and network structures of 1000 census Block Groups in 24 California cities |
| (Levinson 2012) | Journey to work time and mode share |
|
| Street network data, travel time data, and socio-demographic data of 50 US metropolitan areas |
| (Parthasarathi et al. 2012) | Trip distances by trip purpose |
|
| Travel survey data from Minneapolis-Saint Paul, Fort Lauderdale, and Miami |
| (Gao et al. 2013) | Traffic flow |
|
| GPS-enabled taxi trajectory data in Qingdao, China |
| (Parthasarathi et al. 2013) | Travel time perception |
|
| Travel survey data from Minneapolis and Saint Paul |
| (Zadeh and Rajabi 2013) | System Efficiency |
|
| O-D demand, speed and network data from Isfahan, Iran. |
| (Zhang et al. 2015) | Non-motorist safety |
|
| Travel behaviour, land use, crash and network data from 321 census tracts in Alameda County, California |
| (Parthasarathi 2014) | Congestion and usage (VKT) |
|
| Network and congestion data from 50 metropolitan areas across the US. |
| (Wang et al. 2018) | Safety |
|
| Crash and network data from 173 traffic analysis zones in Shanghai. |
| (Parthasarathi and Levinson 2018) | Journey to work travel time |
|
| Census and network data of 189 minor civil divisions in Minneapolis – Saint Paul. |
This policy brief calls for quantification of the road network structure of G20 cities, as doing so reveals a lot of hidden information. A few metrics that can be utilised are listed in Table 2. Metrics such as road network connectivity, centrality measures, density, presence of high-hierarchy roads, etc. are to be evaluated and the cities are ranked accordingly. Crowd-sourced resources such as OpenStreetMap can be used to obtain road network information. Furthermore, even within a city, such metrics should be calculated for different suburbs. More research needs to be conducted on the relationships between socio-economic characteristics of the suburbs and road network structure metrics, including car dependency, lifestyle choices, and the viability of public transport services. On-demand transit offers potential in this regard.
Table 2 A few metrics to quantify road network structure
| Metric | Formula/Notation | Description |
| Nodes | n | Total number of nodes in the network. |
| Edges | m | Number of edges in the network. |
| Node degree | k | The average number of inbound and outbound edges incident to the nodes. |
| Node density | The total number of nodes divided by area (# per km2). | |
| Edge density | The sum of all edge lengths in the network divided by the network area (km per km2). | |
| Circuity | – | Total edge length divided by the sum of great circle distances between the nodes incident to each edge. |
| Self-loop proportion | – | The proportion of edges that have a single incident node. |
| Clustering coefficient* | • Ci = the clustering coefficient of node i; Li = the number of edges between all neighbours of node i; ki = node degree of node i; • Ci denotes the extent to which a node’s neighbourhood forms a complete graph. It reveals how well its neighbours are linked, with a higher clustering coefficient suggesting a denser local network. • Ci = 0 means no connection between any surrounding nodes; Ci = 1 means every neighbouring node is connected with each other. | |
| Meshedness coefficient (α) | The ratio of the actual number of circuits in a network to the maximum possible number of circuits on that planar network. Potential indicator of organisation of the network. | |
| Completeness | The level of completeness in the network using a link-node approach (Parthasarathi, 2014). | |
| Avg. edge length | – | The average edge length of the network |
| Avg. number of lanes | – | The average number of lanes of the network. |
| Proportion of dead-ends | – | The proportion of nodes that are only connected to a single link. |
| Proportion of a specific highway type | The proportion of each of the following highway types in a network: Motorways, trunks, primary, secondary, tertiary, and residential. | |
| Entropy Highway | • I= the number of road types (e.g. primary, secondary, motorway, etc.) within a city; pi = the proportion of edges that fall in the ith road type. • A measure of heterogeneity of road type. | |
| Entropy of Spatial Orientation of Roads |
| |
| Avg betweenness centrality (BC) | – | • Average of BC’s of all nodes within a network • BC of a node evaluates how frequent a node is used, measured by the number of shortest paths that pass through this node divided by the total number of edges. • It is a measure of resilience of cities because the cities with a high maximum BC are more prone to failure or inefficiency should this single choke node fail (Barthélemy, 2004). |
| Closeness centrality (CC) | – | • Average of CC’s of all nodes within a network. • CC of a node is measured by the reciprocal of the sum of the distance from that node to the remaining nodes in the network. • High CC of a node indicates that the node is closer to all other nodes. |
| Degree centrality (DC) | – | • Average of DC’s of all nodes within a network. • DC is calculated as dividing the node degree by n-1, where n is the total number of nodes in the network. • A measure of how important each node is. |
Travel demand estimation
Challenge
Developing traffic simulation models requires access to both road network and travel demand data. The road network data is relatively easy to obtain through various sources such as city authorities, OpenStreetMap, etc. On the other hand, obtaining the travel demand patterns in various cities simultaneously and comparing and contrasting has been challenging. Having access to a database/tool that estimates demand patterns and visualises the output in any selected city would enable researchers and practitioners in faster decision-making and rapid transport planning. For example, the tool can be used to understand day-to-day and within-day demand changes in a city. They can compare the demand patterns in one city with another. They can analyse the impacts of network changes, e.g. adding or removing lanes, changing speed limits, adding or closing new roads, etc., on critical metrics such as trip length, travel times and congestion. The impacts of extreme events such as natural disasters, festivals, lockdowns, etc., on travel patterns, can be studied as well. This tool would also help practitioners in rapid decision making for strategic planning and operational purposes. Furthermore, the tool would provide an opportunity for developing countries to better manage traffic congestion, as cities in these countries are prone to severe congestion and rapid urbanisation (Cohn 2019).
The main challenge in developing such a tool has been access to quality and timely data (Waller et al., 2021). Researchers and practitioners have traditionally relied on origin-destination (OD) demand data obtained through the Household Travel Surveys (HTS). These surveys are conducted as one-shot surveys undertaken every few years (Stopher and Greaves, 2007) and are labour intensive, costly and often outdated. The HTS data is helpful in long-term planning models but not ideal for day-to-day traffic analysis and devising operational strategies.
Many researchers have tried to “estimate” the OD patterns using some field data, notably traffic count data obtained from loop detectors. There have been a few studies lately that used travel time data obtained through Bluetooth scanners, floating cars, Call Data Records (CDR), license plate recognition, etc., in addition, to count data. Loop detector and Bluetooth scanner data suffer from the problem of spatial coverage, CDRs have the problem of location accuracy, and probe vehicle method lacks transferability. Furthermore, relying on survey data is time-consuming and expensive and limits its scalability for rapid deployment (Waller et al., 2021). Therefore, travel demand data for multiple cities is challenging to obtain as there is no consistent and reliable data source or tool. Another key limitation of the existing methods is the reliance on the limited number of observations of traffic counts.
Proposal
We call for the usage of easily accessible pervasive (also referred to as “crowd-sourced” traffic data, in some studies) for travel demand estimation. In recent years, pervasive traffic data sources have become potential options for traffic data collection because of the widespread usage of smartphones (Waller et al., 2021). People have quick access to features such as Bluetooth, Wi-Fi and GPS, and are better connected through social media applications, through which user location data, travel history, travel times, activity behaviour, incidents and traffic speeds are collected. Commercial traffic and navigation data providers (Google, TomTom, HERE, etc.), social media platforms (Facebook, Twitter, Instagram, etc.), mobility-as-a-service aggregators (Uber, Didi Chuxing, Ola, etc.), and fitness service providers (Strava, Google Fit, etc.) make use of this data. Pervasive traffic data has a higher sample size that reflects the traffic conditions better than the probe vehicles (Respati et al. 2018). Furthermore, they have comprehensive spatial coverage and fine temporal resolution and are cost-effective compared with traditional data sources.
The data gets updated in real-time and accounts for fluctuations in traffic activity. Speed/travel time information can be obtained for every road link in the network, which is not feasible with other modes of data collection. However, traffic “count” data cannot be routinely obtained from these platforms owing to privacy issues. Nevertheless, speed patterns are observed to coevolve with traffic volume patterns (Meng et al., 2017), and the data has been used in several studies for traffic analysis and developing network fundamental/flow diagrams. Such data have also been utilised in the past for incident duration prediction (Lin and Li, 2020), designing adaptive traffic signals (Dixit et al., 2020), and congestion estimation (Nair et al., 2019).
Recently, pervasive traffic data have been used in estimating origin-destination travel patterns (Waller et al., 2021). Figure 1 shows the zone-wise estimated trip production and attraction rates (as a percentage of total demand) for the city of Kyiv, Ukraine, at 9AM on the 26th of February, 2022, which is the second day of the ongoing Russia-Ukraine war. Figure 2 shows the congestion index (ratio of travel time to free-flow travel time) from the city centre (Golden Gate) to all the other zones. As may be seen, the congestion index is significantly higher for zones that are on the western side.
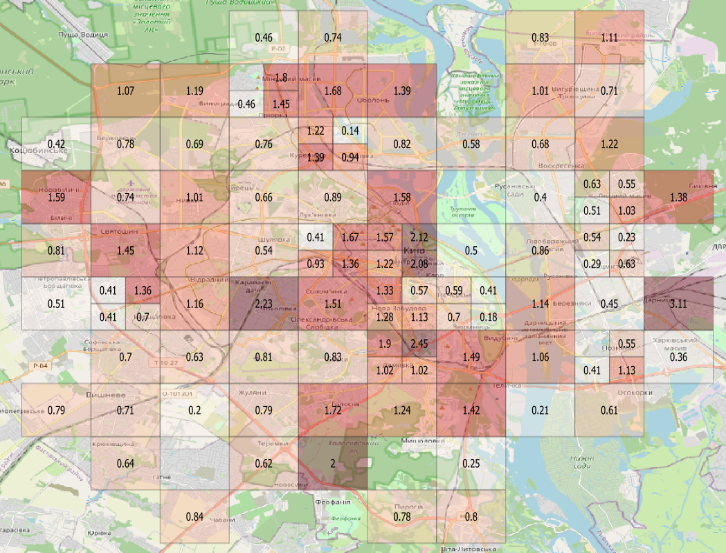 | 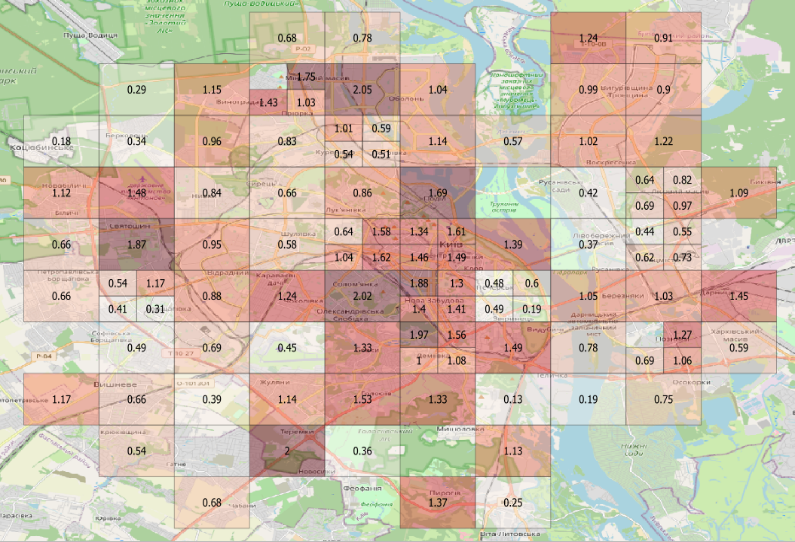 |
Figure 1 Zone-wise estimated trip production and attraction rates (as a percentage of total demand) for the city of Kyiv, Ukraine, at 9AM on 26th February 2022, the second day of the Russia-Ukraine war
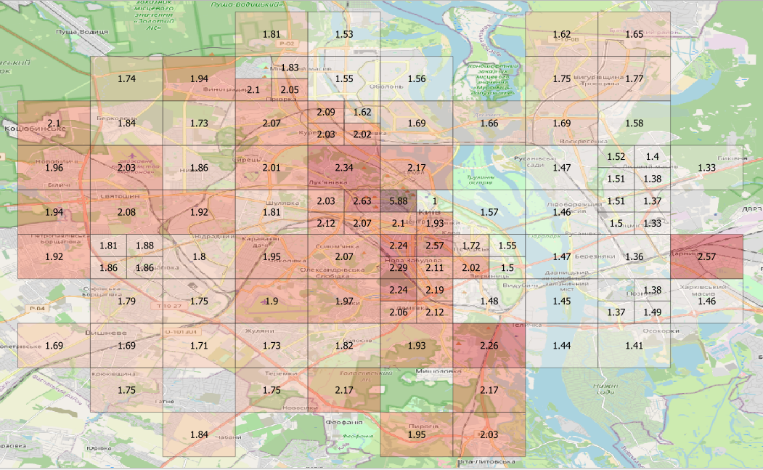
Figure 2 Congestion index (ratio of travel time to free-flow travel time) from Golden Gate (located at the city centre) to all other zones in Kyiv, Ukraine
Equity analysis in transportation infrastructure projects
Challenge
Each demographic in society faces systematic barriers to accessing transport facilities, including regressive transport costs, lack of road safety and absence of network connectivity. Providing infrastructure solutions that result in equitable benefits is essential. However, equity is a multi-faceted, complex problem to solve and incorporate into road infrastructure planning. Because of the various definitions, concepts and views, there is no single way to undertake equity analysis, and no single standard to compare the impacts of road infrastructure projects. Equity is subjective and cannot be certainly defined in terms of “good” or “bad”.
Within the lower-income threshold, vehicle expenses often account for a larger portion of household income. This is regressive since private road-based plans and investments socially exclude persons who are unable to get private vehicles due to financial or physical constraints. Naturally this situation differs across nations with different income-disparity profiles. This social injustice against disadvantaged groups generates a schism that promotes inequity within communities and exacerbates imbalance within a country. In some cities a vicious circle can emerge, where poorer communities are pushed to the urban fringes for cheaper housing with poor public transport – this can leave them car captive and subject to significant commute congestion costs. A brief summary of studies on equity analysis in transportation infrastructure projects is presented in Table 3.
Proposal
The UN states a target of providing “safe, affordable, accessible and sustainable transport systems for everyone by strengthening national and regional development planning”. For this target to be achieved, transport planners need to understand the concepts of equity and how these impact the behaviours of individuals within a transport system. Here, we call for consistent methods to evaluate current/existing transportation infrastructure for all major G20 cities and investigate whether these offer equitable solutions to the public. We also call for urgent recognition of common terminology for equity and what makes up equity.
Needs-based models can be considered to ensure that equity indicators represent the most important transportation benefits suitable for key demographic groups and to achieve desired societal outcomes. Further equity analysis should be conducted with special attention to the impacts of specific demographic populations. Spatial analysis can show where clustered impacts are occurring and can allow policymakers to target their actions towards alleviating these tensions. Furthermore, governing bodies should address those vulnerable to inequitable transport impacts to provide inclusive and sustainable local transport facilities. These include; the poor, women, rural communities, children and youth, persons with a disability and older persons.
There is a distinction between “Equity Standards” and “Equity Indicators”. Equity standards relate to the social value between “good” and “bad” distributions of transport impacts. These standards are not clearly defined but instead are up to governing bodies to decide and put them into practice. On the other hand, equity indicators provide quantifiable or qualitative measures to outline transport actions’ social and distributional impacts. A few potential indicators of equity are provided in Table 4.
Relevance to G20
It is increasingly important for G20 nations to develop rigorous scientific global quantitative tools for the analysis and direct comparisons of cities and regions. This is even more critical when it comes to mobility, transport and the impact of infrastructure on equity and sustainability. The presented research and development outcomes detail a globally oriented methodology and analysis, which enables consistent global city-to-city analysis by utilising emerging data.
Table 3 Summary of studies relating to equity analysis in transport infrastructure
| Research Paper | Researcher(s) & Year | Transport Infrastructure Impact | Equity Indicators | Mathematical Models | Significant Findings |
| Data and Analysis Methods for Metropolitan-level Environmental Justice Assessment | (Purvis, 2001) | Expansion or contraction on transit and auto route options based on socio-demographic considerations | Accessibility in terms of the number of jobs available within 30,45,60 or 75 minutes | A gravity model was used to apply distance parameters. T-test statistics and “standard error of the difference between means” test | Expanded or contracted scenarios offered greater accessibility than the scenario with no change. Additionally, disadvantaged neighbourhoods hold greater transit accessibility, while not-disadvantaged groups have greater auto-accessibility. |
| Benefit distribution and equity in road network design | (Meng and Yang, 2002) | Enhanced road capacity | Parameter β represents the degree of equitability in travel cost distribution | Bilevel programming with a penalty function to simulate an annealing methodology | The greater the parameter β, the greater the coefficient of variance between travel cost distribution. Conversely, greater β values led to asymptotically lower total system costs with a lower limit of conventional CNDP system costs. |
| Highway Investment Planning Model for Equity Issues | (Feng and Wu, 2003) | Highway investing in road upgrades and link additional; budget allocation for highway upgrades | Average speed on each shortest path | Fuzzing programming to solve multi-objective optimisation problems | The switch between travel time to travel speed analysis fostered greater distributive equity. Equity in highway budget allocation was not as effective in facilitating optimised solutions in terms of maximising budget and travel time savings |
| A Non-Parametric Analysis of Welfare Redistribution: The Case of Stockholm’s Congestion Pricing Trial | (Franklin, 2005) | Congestion pricing, economically impacting road users | Movement of costs between low and high-income earners | Mean-matched relative distribution model to evaluate tolled and non-tolled scenarios | Congestion pricing can be regressively or progressively managed. Progressive practices reallocate costs obtained from congestion pricing back into welfare channels and foster economic vertical equity |
| Transport Cost Analysis | (Litman, 2007) | Impact on budget management of road investment | Direct and indirect costs of road infrastructure and users who bear these costs | Cost allocation model including assumptions on congestion, accident, and pollution costs | Past road cost analysis lacked detail in incorporating indirect costs induced by road infrastructure. Road infrastructure costs are horizontally inequitable as non-road users also bear the indirect costs of road users. |
| Equity-Based Land-Use and Transportation Problem | (Lee et al., 2006) | Road capacity enhancements with consideration of land-use development | Parameter β represents the degree of equitability in trip production distribution | Bi-level programming with a penalty function using a genetic algorithm-based approach | Capacity Enhancements drove by increasing β values eventually stabilise under trip production equilibrium. The incorporation of land-use development is also useful in examining urban development in line with transportation facilities. |
| Transportation Equity Study and national balanced development in China | (Shi, 2007) | Highway and expressway enhancements to improve network connectivity | Equity Index (E) about available road infrastructure investment | The entropy-based model incorporated within a traditional cost-benefit analysis | Greater equity between highway and expressway investment projects are needed within China to facilitate greater network-wide economic development |
| VMT Reductions Strategies on Equity | (Carlson and Howard, 2010) | Vehicle miles travelled (VMT) reduction strategies i.e., reduce travel demand | VMT reduction under different demographic subcategories | Comparative analysis of population density statistics against land-use patterns | No single VMT strategy equitably reduced impacts on all demographic groups. Currently, VMT strategies are difficult to implement in rural areas and favour those living in urban metropolitan areas |
| Incorporating spatial equity into interurban road network design | (Mollanejad and Zhang, 2014) | Road Network Design (RND) problem | Gini coefficient regarding inaccessibility to opportunities | Mixed-integer linear programming using all-or-nothing trip assignment to the shortest path problem | New road network design (RND) methods incorporating inaccessibility constraints and equity between large and small cities, allows for greater equity performance in the frame of the Gini Index. This paper shows greater network performance by focusing RND within smaller disaggregated study areas. |
| A Spatial Analysis of City-Regions: Urban Form & Service Accessibility | (Weber et al., 2016) | Improvements in service accessibility via better road link connectivity | Service accessibility and public transport accessibility | Spatial analysis tools used to visualise and qualitatively draw discussion on the distribution of accessible services | Past mismatches in urban development pave the way to an inequitable distribution of public services. The spatial analysis provides a powerful tool in qualitatively identifying these gaps in road network connectivity that can lead to poor service and public transport accessibility. |
| How the Inaccessibility Index can Improve Transport Planning and Investment | (Ciommo, 2018) | Identify areas that require the transport infrastructure changes | Inaccessibility Index | Joint analysis of merged mobility and satisfaction surveys relating to the user and their trip | A need-approach to equity can identify areas for transport planners and policymakers to intervene and assist in improving accessibility in line with what the community needs. |
| Advancing Transportation Equity: Research and Practice | (Van Dort et al., 2019) | Discussion on future transport infrastructure planning and how this can be improved | Intergeneration equity and community-based evaluation | This study uses qualitative measures such as surveying to conduct its research | Quality transport needs to be accessible to all populations and needs the community to be involved in the transportation decision-making process |
Table 4 Axiomatic properties of equity indicators
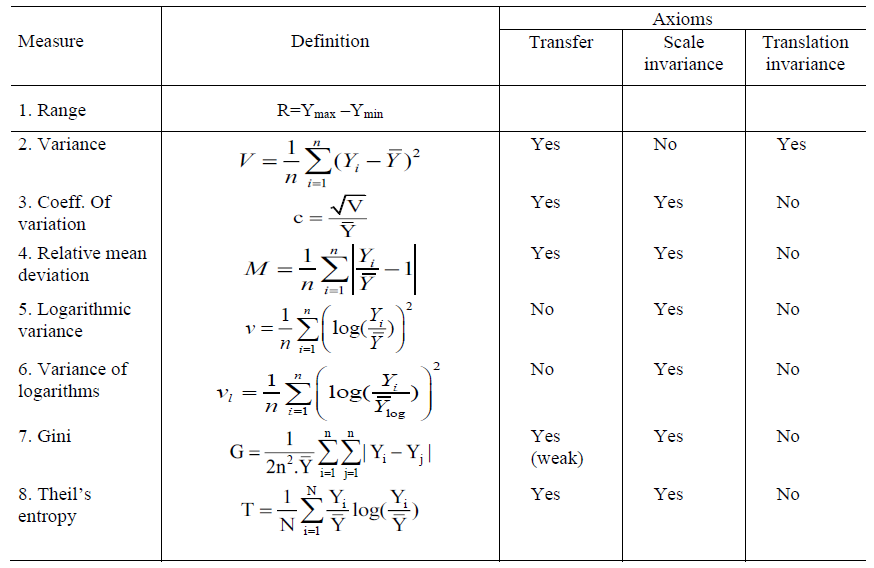
The axiom of transfer or Pigou-Dalton Principle
The Pigou-Dalton (PD) Principle explores the transfer of benefits from high-income groups to low-income groups and is generally applied through the improvement of disadvantaged individuals rather than the compromise of advantaged individuals. Successful transfers can be shown theoretically through the narrowing of max-min gaps or the reduction of disparities. This notion was first expressed by Pigou in 1912 and extended by Dalton in 1920, however, it is now a widely discussed perspective adopted by the Organisation for Economic Co-operation and Development (OECD) (Dalton, 1920; Pigou, 1912). This transfer can be equally applied to non-economic data such as transport accessibility.
The scale invariance axiom
(Kolm, 1976) adds the scale invariance axiom to capture relative equality demands, where inequality should not be affected by proportional increases or decreases in opportunities. If all members are impacted equally then the distribution of impacts should not change. This captures the equity sensitivity of a model and whether changes in a model can lead to deviation across variables in the study.
The translation invariance axiom
On the other hand, the translation invariance axiom refers to the absolute efficiency that can lead to unequal changes in impacts, as long as it does not induce negative impositions. This axiom is set out by the Pareto Principle, which lies at the foundation of welfare economics. It states that “if at least one person is better off with policy A than policy B, and no one is worse off, then A is a better policy”. This suggests that a transport solution that only provides benefits is more efficient than one that achieves greater aggregate benefits at the expense of some (Myles, 1995).
These axiomatic frameworks offer a way to categorise equity indicators and benchmark their performance in portraying these axioms within their measurements.
References
Barthélemy, M. 2004. “Betweenness centrality in large complex networks.” Eur. Phys. J. B, 38 (2): 163–168. https://doi.org/10.1140/epjb/e2004-00111-4.
Boeing, G. 2017. “OSMnx: New methods for acquiring, constructing, analyzing, and visualizing complex street networks.” Computers, Environment and Urban Systems, 65: 126–139. https://doi.org/10.1016/j.compenvurbsys.2017.05.004.
Boeing, G. 2019. “Urban spatial order: street network orientation, configuration, and entropy.” Appl Netw Sci, 4 (1): 67. https://doi.org/10.1007/s41109-019-0189-1.
Carlson, D., and Z. Howard. 2010. Impacts of VMT Reduction Strategies on Selected Areas and Groups. Washington State Department of Transportation, Office of Research & Library.
Ciommo, F. di. 2018. How the Inaccessibility Index Can Improve Transport Planning and Investment. Paris: OECD.
Cohn. 2019. “TomTom Traffic Index: Measuring Urban Traffic Congestion | TomTom Blog.” TomTom. Accessed June 10, 2021. https://www.tomtom.com/blog/traffic-and-travel-information/urban-traffic-congestion/.
Dalton, H. 1920. “The measurement of the inequality of incomes.” The Economic Journal, 30 (119): 348–361. JSTOR.
Dixit, V., D. J. Nair, S. Chand, and M. W. Levin. 2020. “A simple crowdsourced delay-based traffic signal control.” PLOS ONE, 15 (4): e0230598. Public Library of Science. https://doi.org/10.1371/journal.pone.0230598.
Feng, C.-M., and J. Y.-J. Wu. 2003. “Highway Investment Planning Model for Equity Issues.” Journal of Urban Planning and Development, 129 (3): 161–176. American Society of Civil Engineers. https://doi.org/10.1061/(ASCE)0733-9488(2003)129:3(161).
Franklin, J. P. 2005. “A Non-Parametric Analysis of Welfare Redistribution: The Case of Stockholm’s Congestion Pricing Trial.” Submitted to Transportation Research A. Citeseer.
Gao, S., Y. Wang, Y. Gao, and Y. Liu. 2013. “Understanding Urban Traffic-Flow Characteristics: A Rethinking of Betweenness Centrality.” Environ Plann B Plann Des, 40 (1): 135–153. https://doi.org/10.1068/b38141.
INRIX. 2020. “Scorecard.” Inrix. Accessed July 22, 2020. https://inrix.com/scorecard/.
Jiang, B. 2009. “Ranking spaces for predicting human movement in an urban environment.” International Journal of Geographical Information Science, 23 (7): 823–837. https://doi.org/10.1080/13658810802022822.
Kolm, S.-C. 1976. “Unequal inequalities. I.” Journal of Economic Theory, 12 (3): 416–442. Academic Press.
Lee, D.-H., L. Wu, and Q. Meng. 2006. “Equity based land-use and transportation problem.” Journal of Advanced Transportation, 40 (1): 75–93. https://doi.org/10.1002/atr.5670400105.
Levinson, D. 2012. “Network Structure and City Size.” PLOS ONE, 7 (1): e29721. https://doi.org/10.1371/journal.pone.0029721.
Levinson, D., and A. El-Geneidy. 2009. “The minimum circuity frontier and the journey to work.” Regional Science and Urban Economics, 39 (6): 732–738. https://doi.org/10.1016/j.regsciurbeco.2009.07.003.
Liao, Y., J. Gil, R. H. M. Pereira, S. Yeh, and V. Verendel. 2020. “Disparities in travel times between car and transit: Spatiotemporal patterns in cities.” Sci Rep, 10 (1): 4056. https://doi.org/10.1038/s41598-020-61077-0.
Lin, Y., and R. Li. 2020. “Real-time traffic accidents post-impact prediction: Based on crowdsourcing data.” Accident Analysis & Prevention, 145: 105696. https://doi.org/10.1016/j.aap.2020.105696.
Litman, T. 2007. “Developing Indicators for Comprehensive and Sustainable Transport Planning.” Transportation Research Record, 2017 (1): 10–15. SAGE Publications Inc. https://doi.org/10.3141/2017-02.
Marshall, W. E., and N. W. Garrick. 2011. “Does street network design affect traffic safety?” Accident Analysis & Prevention, 43 (3): 769–781. https://doi.org/10.1016/j.aap.2010.10.024.
Martens, K. 2016. Transport Justice: Designing fair transportation systems. New York: Routledge.
Meng, C., X. Yi, L. Su, J. Gao, and Y. Zheng. 2017. “City-wide Traffic Volume Inference with Loop Detector Data and Taxi Trajectories.” Proceedings of the 25th ACM SIGSPATIAL International Conference on Advances in Geographic Information Systems, SIGSPATIAL ’17, 1–10. New York, NY, USA: Association for Computing Machinery.
Meng, Q., and H. Yang. 2002. “Benefit distribution and equity in road network design.” Transportation Research Part B: Methodological, 36 (1): 19–35. https://doi.org/10.1016/S0191-2615(00)00036-9.
Mollanejad, M., and L. Zhang. 2014. “Incorporating spatial equity into interurban road network design.” Journal of Transport Geography, 39: 156–164. https://doi.org/10.1016/j.jtrangeo.2014.06.023.
Myles, G. D. 1995. Public economics. Cambridge university press.
Nair, D. J., F. Gilles, S. Chand, N. Saxena, and V. Dixit. 2019. “Characterizing multicity urban traffic conditions using crowdsourced data.” PLOS ONE, 14 (3): e0212845. Public Library of Science. https://doi.org/10.1371/journal.pone.0212845.
Parthasarathi, P. 2014. “Network structure and metropolitan mobility.” Journal of Transport and Land Use, 7 (2): 153–168. https://doi.org/10.5198/jtlu.v7i2.494.
Parthasarathi, P., H. Hochmair, and D. Levinson. 2012. “Network Structure and Spatial Separation.” Environ Plann B Plann Des, 39 (1): 137–154. https://doi.org/10.1068/b36139.
Parthasarathi, P., and D. Levinson. 2018. “Network structure and the journey to work: An intra-metropolitan analysis.” Transportation Research Part A: Policy and Practice, 118: 292–304. https://doi.org/10.1016/j.tra.2018.09.008.
Parthasarathi, P., D. Levinson, and H. Hochmair. 2013. “Network Structure and Travel Time Perception.” PLOS ONE, 8 (10): e77718. https://doi.org/10.1371/journal.pone.0077718.
Pigou, A. C. 1912. Wealth and welfare. Macmillan and Company, limited.
Purvis, C. L. 2001. “Data and Analysis Methods for Metropolitan-Level Environmental Justice Assessment.” Transportation Research Record, 1756 (1): 15–21. SAGE Publications Inc. https://doi.org/10.3141/1756-02.
Respati, S., A. Bhaskar, and E. Chung. 2018. “Traffic Data Characterisation: Review and Challenges.” Transportation Research Procedia, International Symposium of Transport Simulation (ISTS’18) and the International Workshop on Traffic Data Collection and its Standardization (IWTDCS’18)Emerging Transport Technologies for Next Generation Mobility, 34: 131–138. https://doi.org/10.1016/j.trpro.2018.11.024.
Shi, J. 2007. “Transportation equity study and national balanced development in China.” PROCEEDINGS OF THE EUROPEAN TRANSPORT CONFERENCE (ETC) 2007 HELD 17-19 OCTOBER 2007, LEIDEN, THE NETHERLANDS.
Stopher, P. R., and S. P. Greaves. 2007. “Household travel surveys: Where are we going?” Transportation Research Part A: Policy and Practice, Bridging Research and Practice: A Synthesis of Best Practices in Travel Demand Modeling, 41 (5): 367–381. https://doi.org/10.1016/j.tra.2006.09.005.
Strano, E., V. Nicosia, V. Latora, S. Porta, and M. Barthélemy. 2012. “Elementary processes governing the evolution of road networks.” Sci Rep, 2 (1): 296. https://doi.org/10.1038/srep00296.
UNCTAD. 2020. “Total and urban population.” UNCTAD e-Handbook of Statistics 2020. Accessed June 5, 2021. https://stats.unctad.org/handbook/Population/Total.html.
Van Dort, L., A. Guthrie, Y. Fan, and G. Baas. 2019. Advancing Transportation Equity: Research and Practice. Report. Center for Transportation Studies, University of Minnesota.
Waller, S. T., S. Chand, A. Zlojutro, D. Nair, C. Niu, J. Wang, X. Zhang, and V. V. Dixit. 2021. “Rapidex: A Novel Tool to Estimate Origin–Destination Trips Using Pervasive Traffic Data.” Sustainability, 13 (20): 11171. Multidisciplinary Digital Publishing Institute. https://doi.org/10.3390/su132011171.
Wang, X., J. Yuan, G. G. Schultz, and S. Fang. 2018. “Investigating the safety impact of roadway network features of suburban arterials in Shanghai.” Accident Analysis & Prevention, 113: 137–148. https://doi.org/10.1016/j.aap.2018.01.029.
Weber, R., I. Tammi, S. Wang, and T. Anderson. 2016. A Spatial Analysis of City-Regions : Urban Form & Service Accessibility. Nordregio.
Zadeh, A. S. M., and M. A. Rajabi. 2013. “Analyzing the effect of the street network configuration on the efficiency of an urban transportation system.” Cities, 31: 285–297. https://doi.org/10.1016/j.cities.2012.08.008.
Zhang, Y., J. Bigham, D. Ragland, and X. Chen. 2015. “Investigating the associations between road network structure and non-motorist accidents.” Journal of Transport Geography, 42: 34–47. https://doi.org/10.1016/j.jtrangeo.2014.10.010.