
The world is approaching an historic tipping point. The cost of clean energy technologies such as solar, wind, and batteries are declining rapidly while their performance increases. These technologies have already become less expensive than new-build fossil fuel power generation in many regions and applications. In the coming 10-20 years it is highly likely that clean energy technologies will become less expensive than coal, oil, and gas electricity generation for almost all regions and all applications. When this tipping point is reached, clean, modern, cheap energy infrastructure will rapidly replace dirty fossil infrastructure. While this is good news, unfortunately this tipping point is not going to happen soon enough to prevent dangerous levels of climate change. Electricity generating infrastructure has a long life, typically 20-40 years. The generating infrastructure the world has today already has enough “baked in” future emissions to exceed the 1.5-2°C warming limit committed to in the Paris Agreement. Any new fossil infrastructure being built or planned today risks not only contributing to warming above the Paris threshold, but also being made obsolete before the end of its operating life by rapidly advancing clean energy technologies. G20 nations should take the lead in policies that accelerate improvements in the cost and performance of clean energy technologies, eliminate subsidies and support for fossil fuels, and bring forward the clean energy tipping point. Such policies will bring significant economic benefits to citizens, reduce the risk of being stranded with costly, polluting, fossil infrastructure, and contribute to global efforts to mitigate climate change.
Challenge
Rapid advances in price and performance are bringing clean energy technologies ever closer to the point where they beat fossil fuel technologies on the merits; where they are quite simply cheaper and better. Solar and wind are already beating coal and oil in a number of locations and applications. Once this tipping point is broadly reached, the full might of markets will come to bear and drive a wave of transformation that will replace the fossil fuel economy with a clean energy economy. Betting on fossil fuels at this point in history is about as smart as betting on typewriters in 1976 – the year Apple released its first personal computer.
This paper will argue that it is almost inevitable that the G20 countries and the world will reach this clean energy tipping point, but that it is not happening fast enough. Policies are needed to accelerate progress for three reasons: the sooner the tipping point is reached 1) the lower the risks of damaging climate change, 2) the lower the costs of energy for G20 citizens, and 3) the countries that reach this tipping point first will have significant technological first mover advantages, as well as less risk of being stranded with expensive, technologically obsolete fossil fuel assets.
Proposal
Clean Energy Technologies Get Cheaper Over Time – Fossil Fuels Don’t
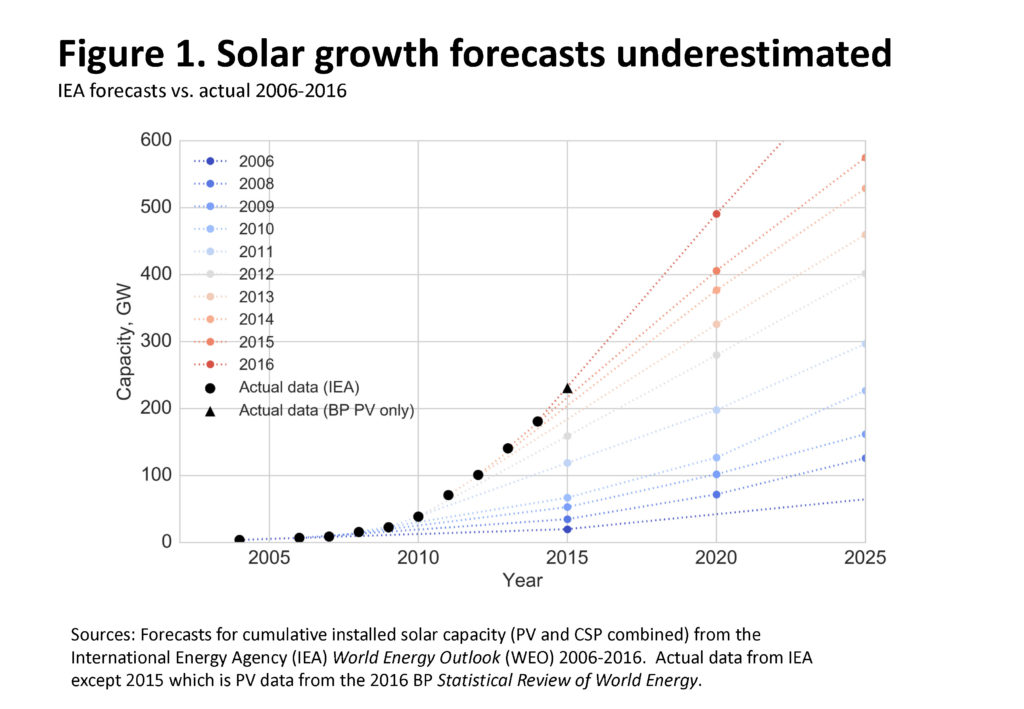
Many energy analysts have been surprised by the rapid growth in clean energy technologies such as solar, wind, and batteries. For example, the International Energy Agency (IEA) has consistently underestimated solar capacity additions (figure 1).[i] This is because few foresaw that the global weighted average levelized cost of utility scale solar photovoltaic (PV) projects would fall 73% between 2010-2017. The installed cost of residential solar has dropped dramatically as well, for example the median price of U.S. residential solar more than halved 2007-2015.[ii] Likewise, the levelized cost of utility scale wind energy has dropped 50% since 2009, battery costs have dropped 58% from 2007-2015, and the cost of LED lights dropped 80 percent from 2010-2015.[iii] Many observers have also been surprised by rapid performance increases. The efficiency of wind turbines, for example, has doubled from 2000-2017.[iv] Likewise, as the cost of electric vehicles (EVs) has come down, their power and range has gone up. EVs a decade ago were limited to a range of around 100 miles, while the latest models today can achieve 335 miles.[v]
 But to people who study technology, this acceleration of progress is not that surprising. In fact, it is quite predictable. Our research team at Oxford has looked at the real, inflation adjusted costs of a large number of goods in the economy over long periods of time.[vi] These goods fall into two categories: those whose costs fluctuate over time but overall do not decline versus goods whose costs have a long-term downward trajectory (figure 2).
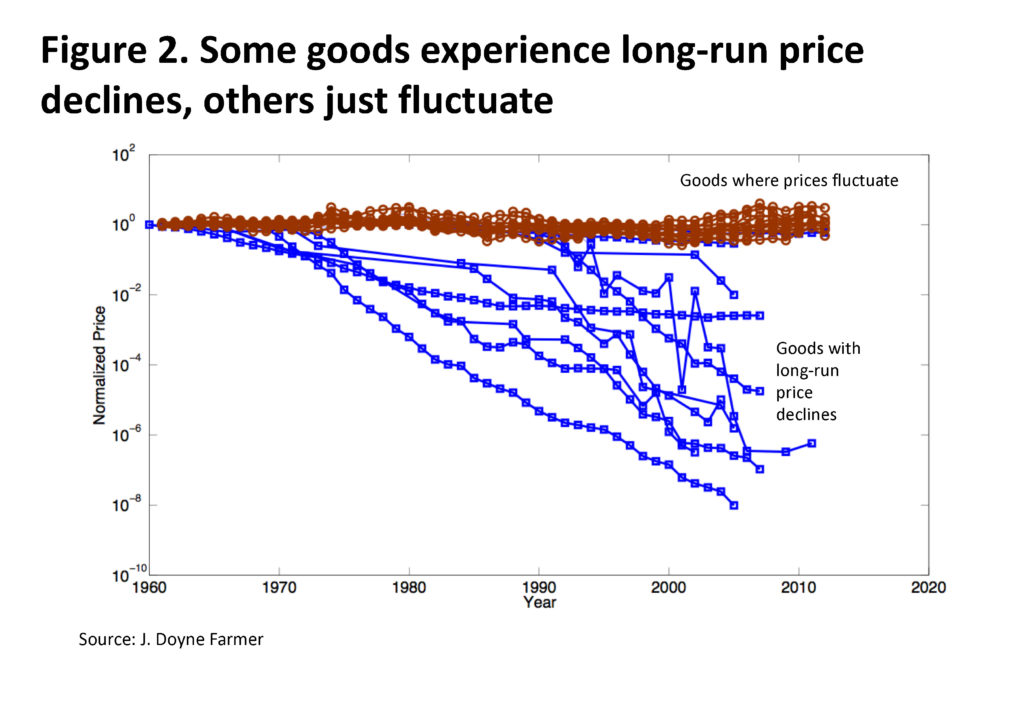
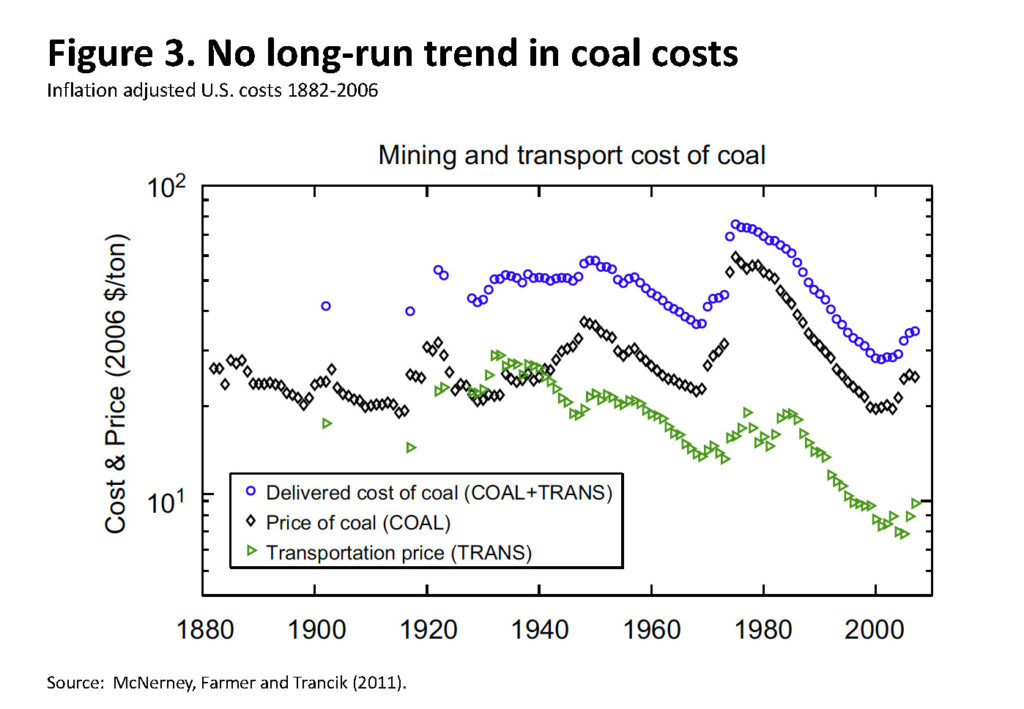
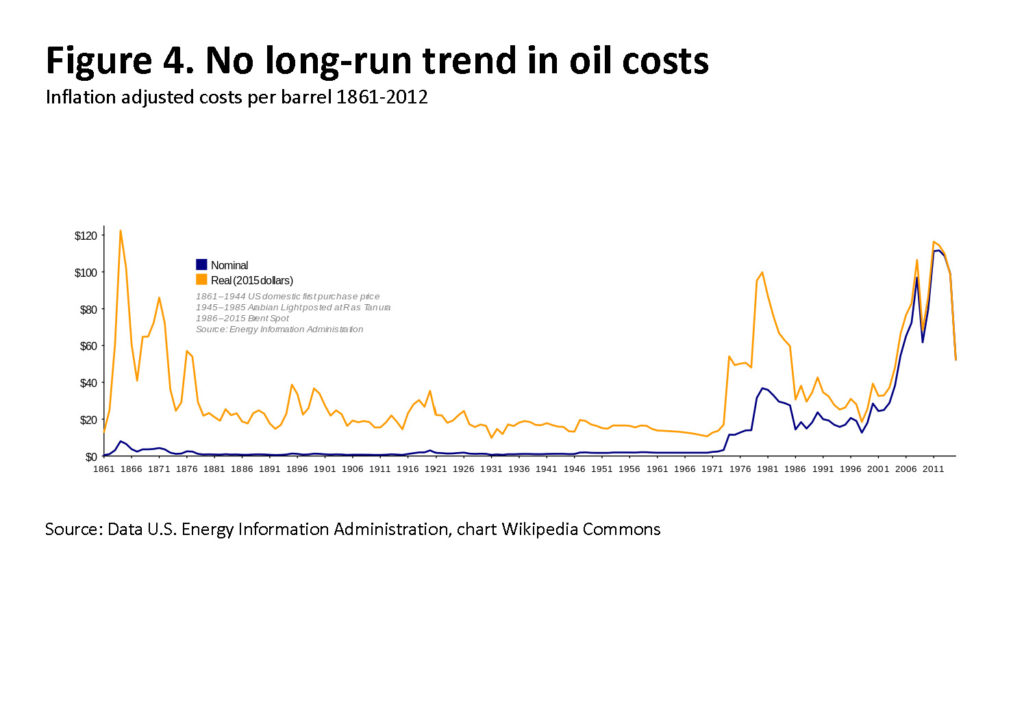
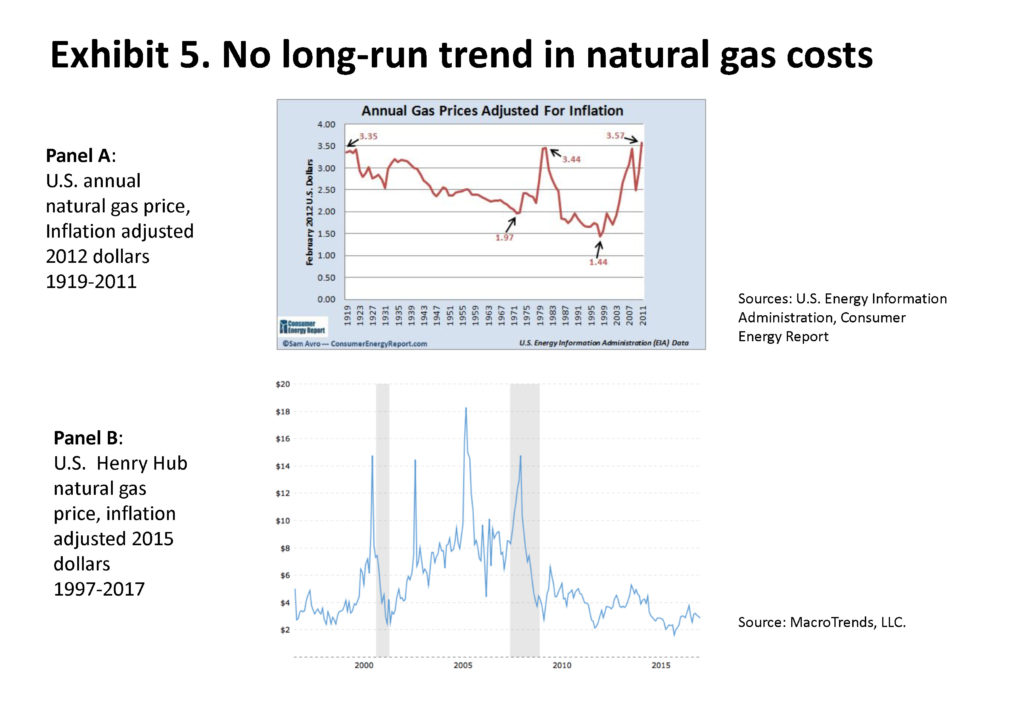
Many goods extracted from the earth, such as various minerals and fossil fuels, fall into the first category. They have seen large cost fluctuations but their costs today are close to their costs a century ago. For example, U.S. coal costs are roughly the same today as in 1900[vii] (figure 3), oil costs are roughly the same today as in the 1860s (figure 4), and natural gas prices are about the same today as in the early 1900s (figure 5, panel A) despite the recent cost declines from fracking (panel B).
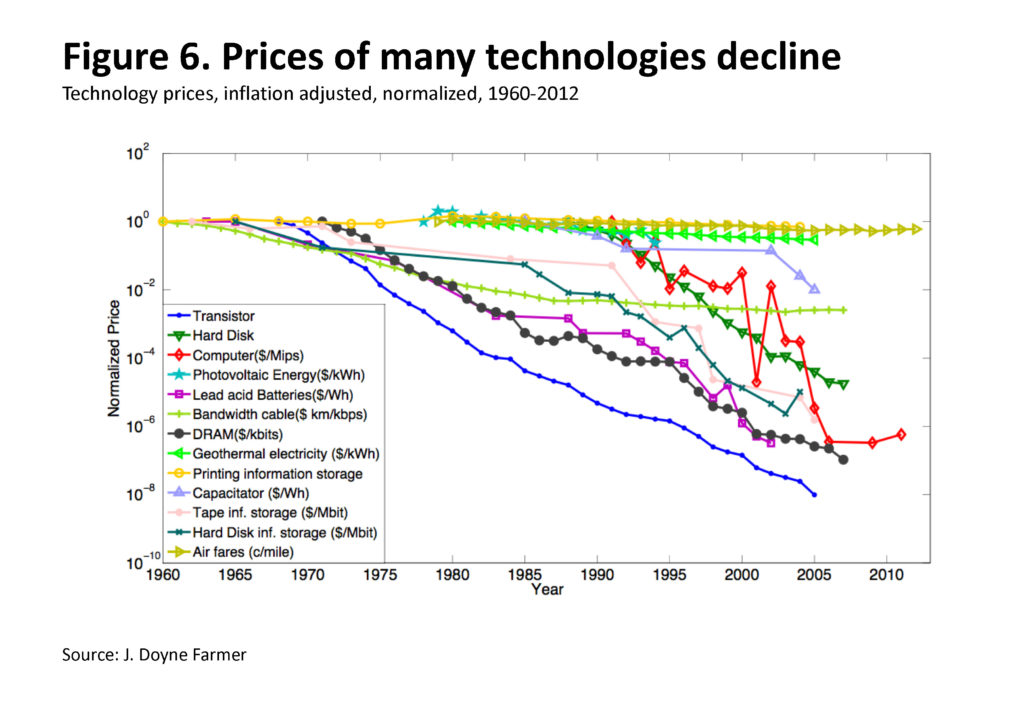
But the costs of other goods, notably knowledge products such as transistors, gene sequencing, solar modules, and batteries have dropped significantly through time (figure 6). Not only do the costs of these goods follow a very different path, they are persistent: If the cost has dropped in the past, it tends to keep dropping in the future, at roughly the same rate. There are of course exceptions, but these are rare.
The energy sector has gone through a series of transformations over time and the extraction of fossil fuels has become increasingly technologically sophisticated. But as various sources of fossil energy have been drawn down, the difficulty and costs of extraction have risen commensurately. For example, as accessible on-shore oil sources have been drawn down, the industry has shifted to off-shore, then deep off-shore, the arctic, horizontal drilling, tight oil, and tar sands. The main impact of technological advance in fossil fuels has been to make new sources available to meet rising global demand, but this has not led to a long-term decline in prices for end-users.
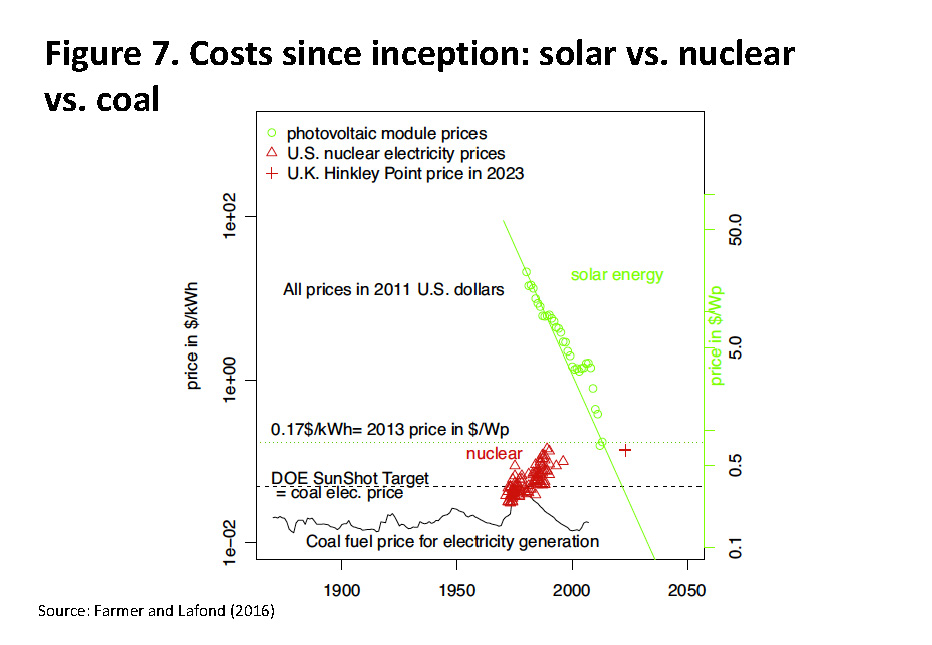
In contrast, solar energy modules have dropped in price by a factor of roughly three thousand since their introduction for the U.S.’s Vanguard Satellite in 1957. This is illustrated in figure 7, which compares the costs of three technologies relating to power generation from their introduction to present: solar modules, coal, and nuclear power. The price of coal fluctuates but remains flat, nuclear energy goes up by roughly a factor of three, while solar modules follow a pattern of exponential price decline similar to Moore’s Law, dropping at a rate of roughly 10% per year.
While Moore’s Law describes technology progress over time, most technologies follow a more general function known as Wright’s Law, named after Theodore Wright, an American engineer who discovered it in 1936 while working on aircraft production. According to Wright’s Law the rate of progress is dependent on the cumulative production volume of the technology, rather than on time as in Moore’s Law. Wright’s Law curves are also known as experience or learning curves to emphasize that the price and performance improvements are a function of the knowledge accumulated from experience working with the technology.
Clean energy technologies such as solar, wind, batteries, and LED lights, are firmly established on Wright’s Law curves. The recent rapid progress in solar prices, for example, can largely be attributed to major increases in cumulative production volumes due to increased global solar demand. This increase in demand in turn has largely been driven by policies such as Germany’s feed-in-tariffs[1] and China’s major expansion of solar capacity. In short, the more solar, wind, batteries, and other clean energy technologies produced, the cheaper and better they have become, and will continue to become—something the historical evidence says is not true of fossil fuels or nuclear power.
While renewables have increasingly become cost competitive with fossil fuels, challenges remain in integrating large-scale renewables into power grids. However, grid technologies are improving as well and utilities around the world are increasingly gaining experience with managing high levels of renewables. For example, the UK has recently experienced three zero coal days and a day with over 50% of power from renewables. Likewise, Germany has experienced multi-hour periods with 100% of its electricity needs fulfilled by renewables, and the U.S. state of California’s Independent System Operator has conducted experiments using smart inverter technology that demonstrate the potential for reliably integrating very high levels of utility-scale solar into its grid.[viii]
Rapidly Approaching Two Tipping Points
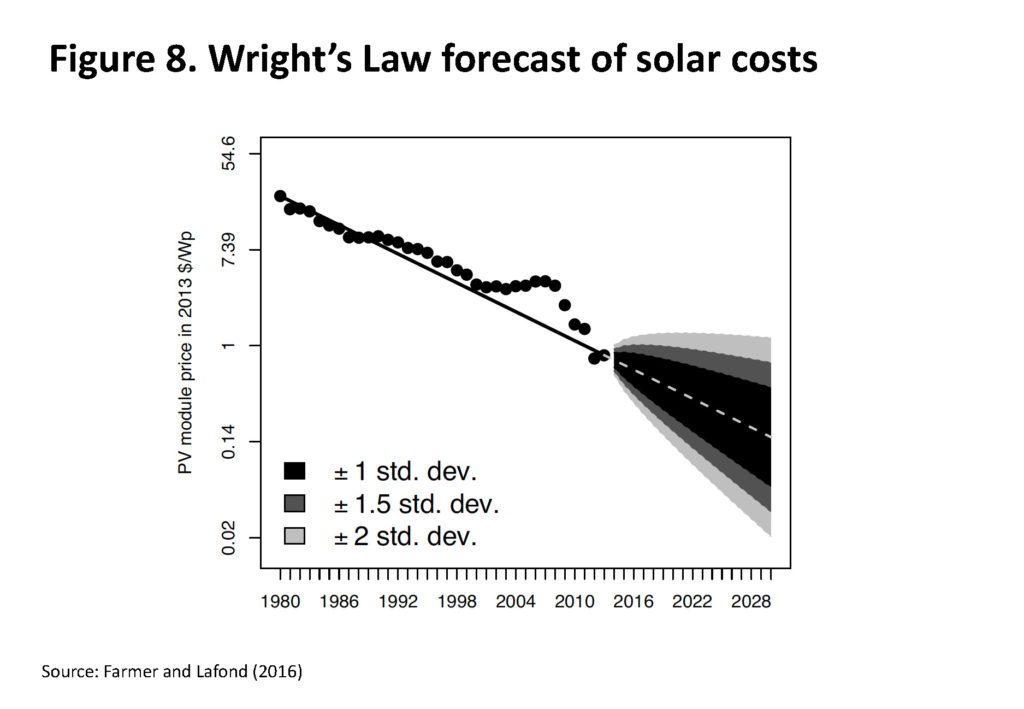
The regularity of Wright’s Law curves allows us to make projections of future renewable cost declines with a high degree of confidence (figure 8.)
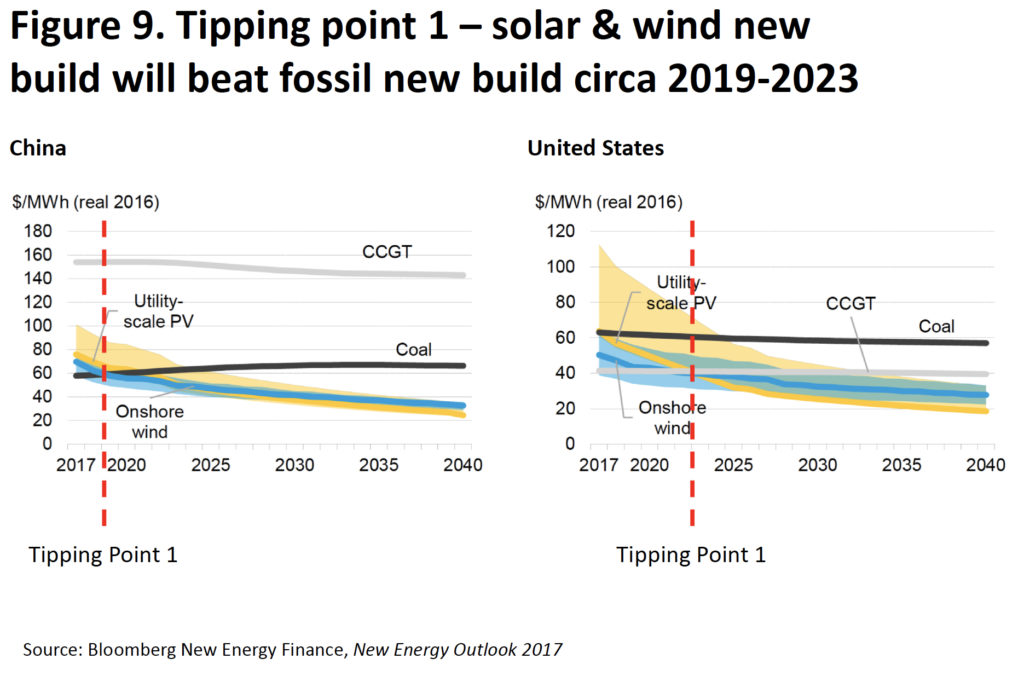
Work by Bloomberg New Energy Finance and others forecast that based on Wright’s Law experience curves, solar and wind are on track to reach two tipping points.[ix] The first is when new-build solar and wind with storage will beat new-build coal, oil, and gas. In many countries and situations this is already happening. Recent capacity auctions in countries such as Chile, Saudi Arabia, Mexico, Dubai, Peru, the UK, and Germany, have set new low-cost records and demonstrated the ability of renewables to beat fossil fuels, particularly coal, for new-build energy supply. Bloomberg projects that this first tipping point will broadly be reached in countries such as China, the U.S. and Germany by the early to mid 2020s if not sooner (figure 9).
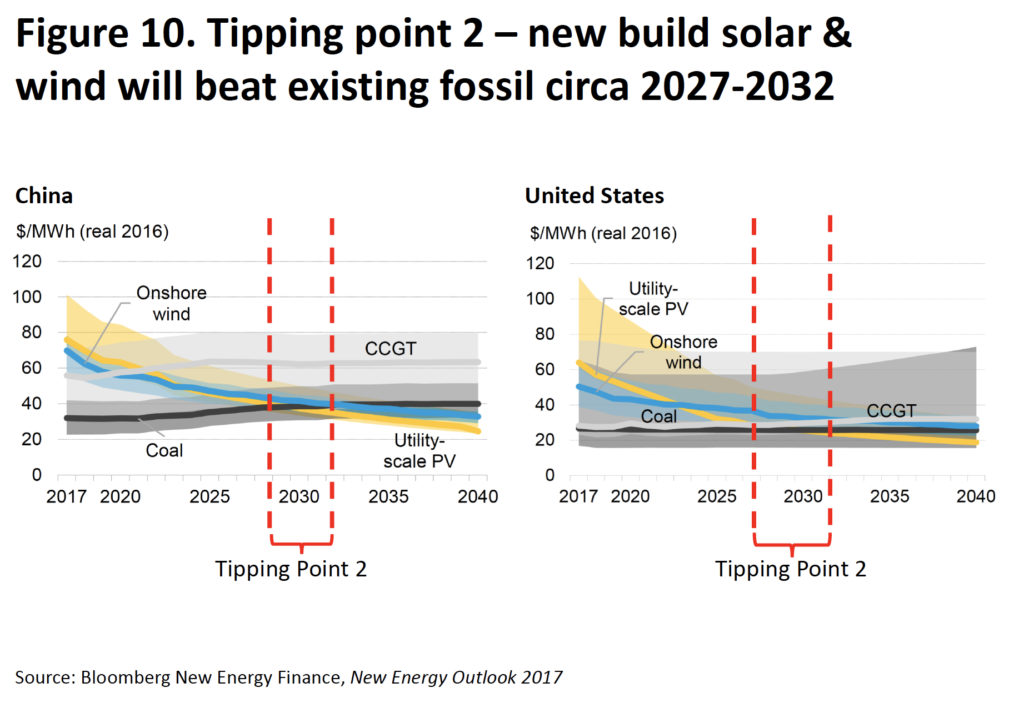
The second tipping point is when new-build solar and wind with storage beat existing fossil plants. Again, this tipping point has already been reached in some locations and situations. For example, in 2017 Xcel Energy, a utility in the U.S. state of Colorado solicited bids for replacing two aging coal plants with new power sources. The bids for solar and wind plus storage were not only lower than new-build coal and competitive with new-build natural gas, they were lower than the operating cost of 75% of the existing coal plants in the state.[x] In other words, Colorado energy consumers would save money by replacing existing coal with new renewables. When new-build renewables regularly beat the operating costs of existing fossil assets this is when rapid, large scale, market-driven replacement of the energy infrastructure will begin. Bloomberg New Energy Finance projects this to occur in the late 2020s to early 2030s across the developed countries and China, depending on national policies (figure 10).
The Need to Accelerate
While this progress is encouraging, without intervention, the clean energy tipping point will not be reached in time to avoid exceeding the 1.5-2°C degree warming limit agreed to in Paris. As recognized in the agreement, the science shows that in order for temperatures to stabilize at any level, greenhouse gas emissions and sinks must eventually reach a net-zero balance. This means that the world has a finite “carbon budget” of emissions before they must drop to net-zero.[xi] Current projections are that the world’s carbon budget will be used up by approximately mid-century and any positive emissions beyond then will cause global temperatures to rise above 1.5-2ºC degrees creating significant risks.[xii]
While mid-century may sound comfortably far off, it isn’t. Energy-using infrastructure has a long-lifetime: 30-60 years for power plants, 10-30 years for transport, and decades or even centuries for buildings. So, the infrastructure that G20 countries are building and planning today will determine their emissions mid-century. We and our colleagues have calculated that the power generation infrastructure already existing today has enough “baked-in” future emissions to exceed the world’s carbon budget and lead to warming over 2ºC degrees.[xiii] Our team estimates that the stock of existing power generation capacity already commits the world to approximately 300 GtCO2 of future emissions above a 2ºC carbon budget.[xiv] The pipeline of currently planned generation projects would add a further 270 GtCO2 of committed future emissions. In order to meet the Paris targets the world will need to strand approximately 20% of existing fossil based generating assets, replace those assets with new zero emissions assets, and build 100% of new power assets going forward based on zero emissions technologies. This means that the world needs to reach tipping point 1 now and tipping point 2 in the next 10-15 years at the latest. If not, in the coming decades the world is likely to be irreversibly committed to warming above 2ºC that will be highly damaging and costly or impossible for humankind to adapt to.
In addition to this environmental imperative, accelerating the tipping point brings forward the point when the citizens of G20 countries can enjoy access to energy that is lower cost than their existing supplies today, as well as greater energy security as supplies of renewable energy are infinite and available to all countries.
Policymakers thus face four stark choices:
- Continue to build new fossil generating assets, but then meet their Paris commitments by shutting down a significant percentage of those assets before the end of their economic life, thus stranding investors and ratepayers with large economic losses; or
- Continue to build new fossil generating assets, but face potentially enormous costs of either retrofitting carbon capture and storage (CCS) or directly removing CO2 from the atmosphere through land-based biological processes (potentially interfering with food systems) or expensive industrial direct air capture; or
- Continue to build new fossil generating assets, fail to meet their Paris commitments and face the economic, human, and planetary consequences of uncontained climate change; or
- Accelerate cost reductions and performance improvements in clean energy to the tipping point, shift all new-build energy to clean energy, over time replace all fossil sources with clean energy by 2050, thus providing citizens with low-cost, secure, energy, while reducing climate change, pollution, and health risks, and creating jobs and growth from the energy technologies of the future.
Proposals
Only the fourth choice does not involve significant economic costs and risks to human well-being. Given this, a primary goal of energy policy should therefore be to drive the cost of clean energy downward and its performance upward to reach the two tipping points as quickly as possible. This strategy can be thought of as “make clean energy cheap.” This is in contrast to the traditional approach which has been to “make fossil energy expensive” through regulation and putting a price on carbon emissions (i.e. cap-and-trade or a carbon tax). While there are strong economic arguments for carbon prices and regulation, and while they are gradually spreading in coverage and increasing in price level, they have proven politically difficult to implement in many countries, as there are concerns about the near-term costs on consumers, many policymakers are skeptical of increasing taxes or regulation, and not surprisingly the fossil fuel industry strongly resists such action. While policymakers should continue to look for avenues to create a price on carbon, they should also examine strategies for “making clean energy cheap.” There are three levers for accelerating the price/performance progress of clean energy technologies:
- Support Clean Energy R&D
The first lever is to significantly boost clean energy R&D. Most G20 governments have made public commitments to the Mission Innovation initiative whose goal is to double current annual public R&D funding in clean energy to $30 billion globally by 2020.[xv] A key step is to ensure that those commitments are fulfilled, that the remaining G20 countries join the pledge, and the ambition of the pledges increases. But studies show that in all of the countries participating in Mission Innovation, private sector investments in clean energy R&D outweighs public sector investments by orders of magnitude.[xvi] So it is also critical for countries to take policy steps to encourage the private sector to significantly increase its R&D investments as well, for example through R&D tax credits, public/private R&D partnerships, and government supported innovation competitions.
- Enlarge the Clean Energy Market
But the best way to create incentives for private sector R&D investment is for companies to see the prospect of a large future market.[xvii] Many G20 governments have played roles in market creation and initial enlargement, even if the private sector is the long-term driver (e.g. mobile phones).[xviii] History shows that government market creation/expansion can help increase cumulative production volumes thus driving new technologies down the Wright’s Law curve to the tipping points where market forces take over. The early days of the semiconductor market in the 1950s and 60s were dominated by government customers, notably the U.S. military and space program. This drove cumulative volumes up, prices down, and performance up, and then market forces took over and drove rapid adoption of semiconductors by businesses and consumers. Governments have a similar opportunity with clean energy. Policies that would encourage market expansion include:
- Auctions for clean energy power
- Investment incentives (e.g. tax credits)
- End-user adoption incentives (e.g., feed-in-tariffs tax credits)
- Performance standards (e.g. renewable portfolio standards)
- Government purchasing (e.g. energy, buildings, vehicles)
- Removing subsidies for fossil fuels
- Carbon pricing
- Enable Clean Energy Deployment
Finally, even as clean energy sources become cost-competitive and even cheaper than fossil fuel sources, a further set of barriers to their deployment must be addressed. Current grid systems and other infrastructure are optimized for the fossil fuel economy. Critical public investments and reforms will be required to enable large scale renewable adoption. These include:
- Smart-grid R&D and investments
- Demand management technology R&D and adoption incentives
- Grid enlargement, interconnect investments
- Electric vehicle charging infrastructure investments/incentives
- Grid governance and power market reform
***
Just as Moore’s Law revolutionized the information world, Wright’s Law is revolutionizing the energy world. Clean energy technologies are riding the Wright’s Law curve and will out-innovate and out-compete fossil fuel commodities in the coming decades. The nations of the G20 a choice: they can resist this technology progress and continue to invest in and subsidize fossil fuel infrastructure, thus wasting public money and endangering the climate. Or they can ride the Wright’s Law curve and accelerate the transition to the clean energy economy benefitting their citizens today and generations to come. Fossil fuels will ultimately be replaced by clean energy technologies as surely as typewriters were replaced by computers. But the question for humankind is will it happen in time? The answer is in the hands of G20 leaders today.
Acknowledgements
The authors are grateful for the contributions of Myles Allen, Ben Caldecott, Francois Lafond, Richard Millar, Alex Pfeiffer, Jacquelyn Pless, Huei-Chun Su, Alex Teytelboym, and Rupert Way. All errors are their own.
[1] A feed-in-tariff is a payment made by a utility (usually with government support) to a non-utility producer of low-carbon energy (e.g. a household or business with solar panels or wind turbines) to sell the power they produce but do not use themselves to the grid. The tariffs are designed to incentivize renewable energy adoption.
References
- Forecasts for cumulative installed solar capacity (PV and CSP combined) from the International Energy Agency (IEA) World Energy Outlook (WEO) 2006-2016. Actual data from IEA except 2015 which is PV data from the 2016 BP Statistical Review of World Energy. Also see U.S. Energy Information Administration (2016). Wind and Solar Data and Projections from the U.S. Energy Information Administration: Past Performance and Ongoing Enhancements, March 2016.
- IRENA (2018), Renewable Power Generation Costs in 2017, International Renewable Energy Agency, Abu Dhabi and U.S. Department of Energy, Lawrence Berkeley National Laboratory (2016). Tracking the Sun IX.
- Liebreich, M. (2016). Bloomberg New Energy Finance Summit, 5 April, 2016. And Nyquist, S. (2015). Peering into energy’s crystal ball. McKinsey Quarterly, July 2015.
- Henbest, S. (2017). Energy to 2040 – Faster Shift to Clean, Dynamic, Distributed. Bloomberg New Energy Finance, June 26, 2017.
- 2009 Nissan EV-11 (Leaf prototype) with 24 kWh Li-ion battery vs. 2016 Tesla Model S with 75 kWh battery.
- Farmer, J.D., Lafond, F. (2016). How predictable is technological progress? Research Policy, 45, 647-665.
- McNerney, J., Farmer, J.D., Trancik, J.E. (2011). Historical costs of coal-fired electricity and implications for the future. Energy Policy 29 (6), 3042-3054.
- California ISO (2017). Using Renewables to Operate a Low-Carbon Grid: Demonstration of Advanced Reliability Services from a Utility Scale Solar PV Plant. January 11, 2017.
- Bloomberg New Energy Finance New Energy Outlook 2017, Henbest (2017), Farmer & Lafond (2016).
- Xcel Energy (2017). Public Service Company of Colorado, 2016 Electric Resource Plan: 2017 All Source Solicitation 30-day Report, CPUC Proceeding No. 16A-0396E, December 28, 2017. Also see Roberts, D. (2018). In Colorado, a glimpse of renewable energy’s insanely cheap future. Vox.com, June 16, 2018.
- Rogelj., Schaeffer, M., Meinshausen, M., Knutti, R., Alcamo, J., Riahi, K., & Hare, W. (2015). Zero emissions targets as long-term global goals for climate protection. Environmental Research Letters, 10(10): 105007.
- Intergovernmental Panel on Climate Change (2014), Fifth Assessment Report.
- Pfeiffer, A., Millar, R., Hepburn, C., Beinhocker, E. (2016). The ‘2ºC capital stock’ for electricity generation: Committed cumulative carbon emissions from the electricity sector and the transition to a green economy. Applied Energy, 179, 1395-1408.
- Pfeiffer, A., Hepburn, C. Vogt-Shilb, A. and Caldecott, B. (2018). Committed emissions from existing and planned power plants and asset stranding required to meet the Paris Agreement. Environmental Research Letters, 13, 054019
- Mission Innovation (2016). “Enabling Framework” for Mission Innovation.
- Georgeson, L., Maslin, M. and Poessinouw, M. (2016). Nature Comment: Clean up energy innovation. Nature, 538, 27-29.
- Energy Innovation: Policy & Technology LLC, Policies That Work, December 2015.
- Mazzucato, M. (2015). The Entrepreneurial State, 2nd edition. Anthem: London.