Homepage » Programs » Socio-Economic Transformation: Recoupling Dashboard » Recoupling Dashboard 2020
.
The Recoupling Dashboard 2020
The Recoupling Dashboard is a country-specific research tool to measure the wellbeing of societies beyond GDP and illustrates the correlation of economic prosperity, social prosperity and environmental sustainability. The Recoupling Dashboard harmonizes social prosperity in two innovative new indexes (agency and solidarity) alongside two traditional indexes (economic prosperity through GDP and environmental performance) to capture these fundamental dimensions of human wellbeing.
The Recoupling Dashboard’s innovative approach sheds light on the decoupling of societies and provides an empirical basis for mobilizing action in government, business and civil society to promote a recoupling of economic and social progress.
If the purpose of governments and businesses is to promote the public interest, the newly debuted Recoupling Dashboard suggests that government and business decisions include assessments of their impacts on solidarity and agency. This is the first step toward reinventing our governance systems.


The rise of populism, growing nationalism, a backlash against globalization and multilateralism – the world today is defined by great challenges. The main driver is the misunderstanding of what constitutes human wellbeing. In the presence of globalization and technological advances, many countries rely solely on indexes of economic prosperity, like GDP, which are inadequate to measure human wellbeing. In Recoupling Economic and Social Progress (first published in Global Perspectives by University of California Press), the authors, Dennis J. Snower and Katharina Lima de Miranda, propose a new theoretical model that gives a new perspective on the measurement of wellbeing beyond GDP: The Recoupling Dashboard. It introduces two new, innovative indexes, agency and solidarity, they propose be examined alongside economic prosperity as well as environmental sustainability.
The urgent need for Recoupling
In the last four decades, globalization and technological advances have generated significant growth of GDP, but have been accompanied by rising inequality, climate change, a rising sense of disempowerment and social alienation among various population groups. In many countries around the world, economic prosperity, environmental performance and social prosperity are no longer aligned, they are decoupled.
To stop the fragmentation of our societies and to shape a sustainable economy, more than GDP and shareholder value is required to guide governments and businesses. Measuring wellbeing in the 21st century must also take into consideration social solidarity and personal agency, as well as environmental sustainability. A measurement to ensure recoupling of economic and social progress is needed.
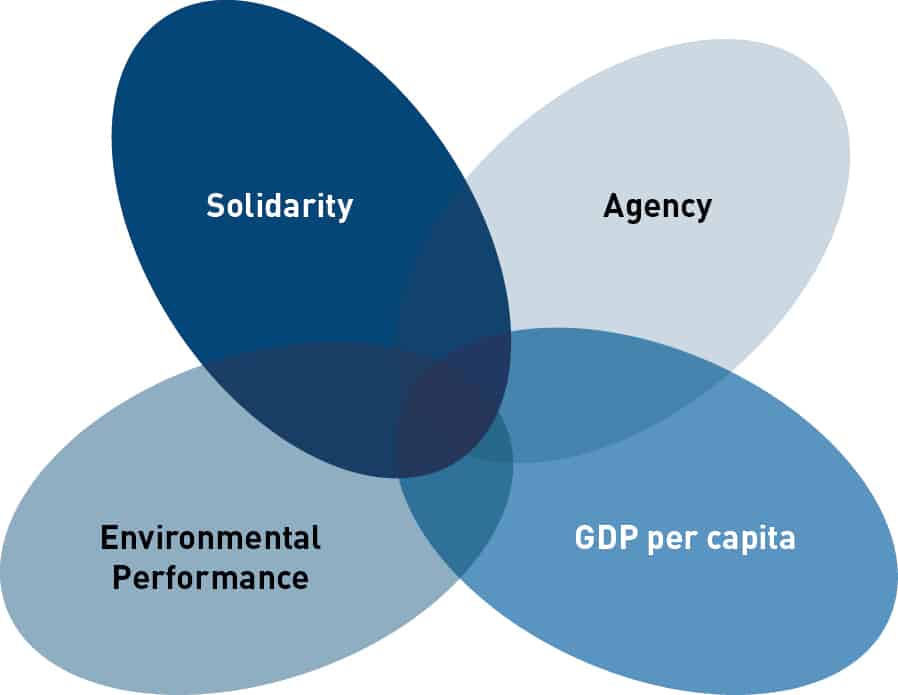
To analyze, record and map the conditions for a recoupled society, the Recoupling Dashboard consists of four indexes that embody a SAGE approach to assessing human wellbeing. These indexes aim to denote a wide-ranging sagacity in the pursuit and satisfaction of fundamental human needs and purposes. With the incorporation of agency and solidarity, the Recoupling Dashboard challenges the traditional economic understanding of human wellbeing.
Solidarity (S) covers the needs of humans as social creatures, living in societies that generate a sense of social belonging. The Social Solidarity Index is measured across three components Giving Behavior, Trust in other people and Social support.
Agency (A) involves empowerment and covers people’s need to influence their fate through their own efforts. So the new Agency Index is measured across five components Labor market insecurity, Vulnerable employment, Life expectancy, Years in Education and Confidence in Empowering Institutions.
Material Gain (G) may be represented by Gross Domestic Product per capita.
Environmental sustainability (E) may be measured by the Environmental Performance Index (EPI).
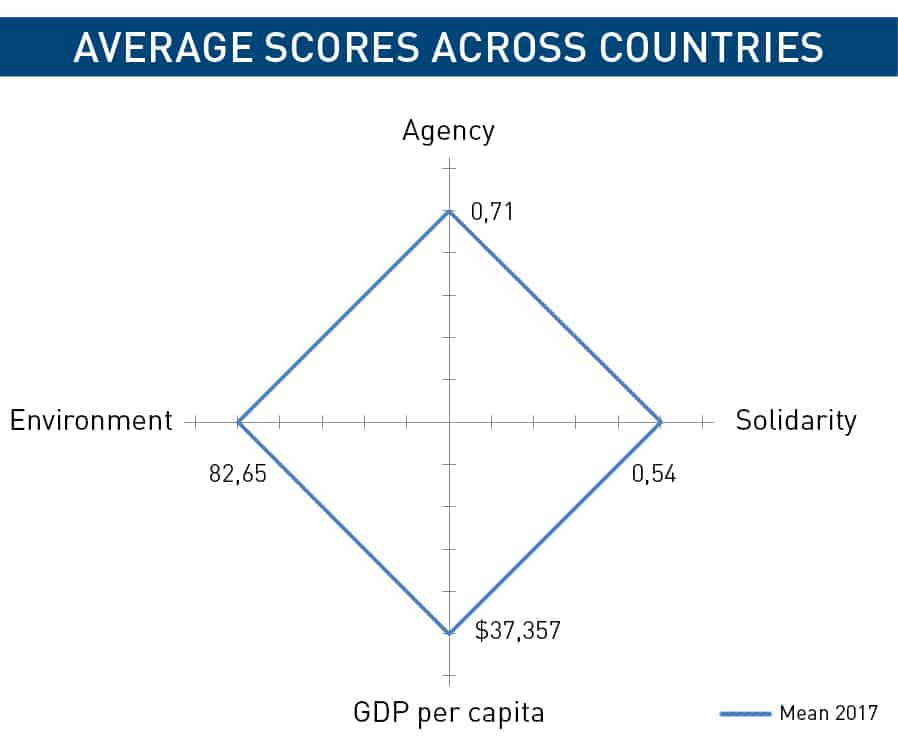
Summarized on an X-Y-plane, the Recoupling Dashboard gives a visualization of how the relationship between the four dimensions varies. The Recoupling Dashboard provides a view of the average scores across countries. It also makes it possible to depict the characteristics of the dimensions per country.
The Recoupling Dashboard includes data from more than 30 countries from between 2007 – 2018 and allows for cross-country comparisons
The data used is exclusively provided by external sources, such as the OECD, the World Bank and data projects. In the first edition of the paper, data from the following countries were included: Australia, Austria, Belgium, Brazil, Canada, Chile, China, Czech Republic, Denmark, Finland, France, Germany, Greece, Hungary, Iceland, India, Ireland, Israel, Italy, Japan, Luxembourg, Mexico, Netherlands, New Zealand, Norway, Poland, Portugal, Russian Federation, South Africa, Spain, Sweden, Switzerland, Turkey, United Kingdom, United States.
With further elaboration of the two new indexes solidarity and agency, the Recoupling Dashboard can become a powerful tool to assess how decisions by governments and businesses affect human wellbeing.
Currently, policy measures are evaluated primarily in terms of their impact on GDP. Similarly, business decisions related to production, employment and future investments are made primarily in terms of maximizing shareholder value. The Recoupling Dashboard is a first step towards reinventing government systems with the aim of recoupling economic and social prosperity.
Cross-country comparisons and development over time
The Recoupling Dashboard shows that solidarity and agency develop differently over time and across countries compared to indexes of GDP per capita and environmental sustainability.
On the country-level, it becomes clear that countries with a high GDP are not necessarily ones that show high solidarity or agency. In fact, many high-income countries show a substantial decrease in the Solidarity Index over time. A detailed overview of country results can be found here. The way in which the four dimensions develop differently over time instead of moving together is the first indication of a decoupling of economic and social progress. Other graphs show that the development of the solidarity and agency index over time is distinct from the time paths of GDP per capita.
Rankings and data sources: https://www.global-solutions-initiative.org/recoupling-dashboard-homepage/recoupling-dashboard-2020/recoupling-dashboard-world-rankings/
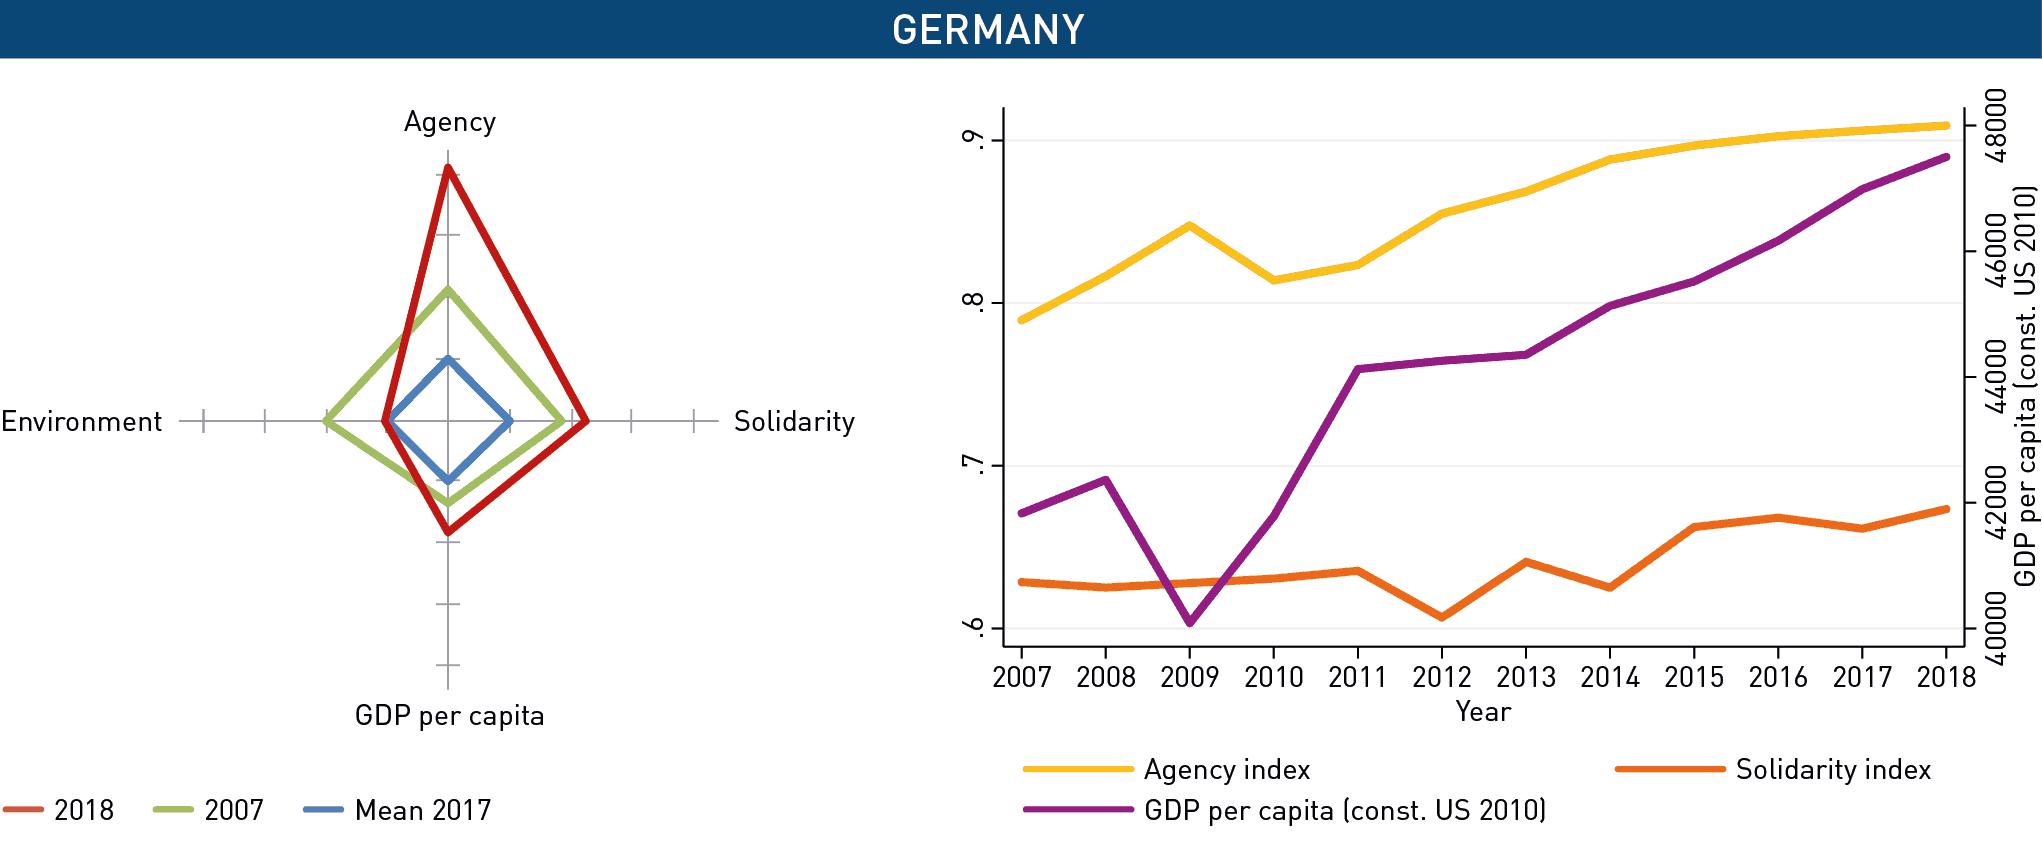
Germany
Improvement, except for environment
From 2007 to 2018, the Agency Index rose substantially, whereas the Solidarity Index slightly increased as did GDP per capita. There was also a decrease in environmental sustainability. The authors term this “liberal communitarianism.” Over time, one can observe that agency continues to rise along with GDP per capita, while the development of social solidarity has stagnated.
United States
Improvement, except collapse of solidarity, stagnant agency
From 2007 to 2018, there is an increase in GDP per capita, accompanied by a stagnation in agency and a decrease in solidarity, as well as a slight increase in environmental sustainability. The United States has experienced a progressive decoupling of GDP from agency and solidarity in recent years, particularly after the financial crisis in 2008.


United Kingdom
Improvement, except collapse of solidarity
From 2007 to 2018, the Recoupling Dashboard shows a rise in agency and GDP per capita, while solidarity has fallen, indicating the country has become more neoliberal. Over time, the United Kingdom has experienced a progressive decoupling of GDP from agency and solidarity, particularly after the financial crisis in 2008.
India
Modest improvement except in environment
At the beginning of the evaluation period 2007, India was the country with the lowest income in the sample.
Just like the other selected middle-income countries (Brazil, China, Russia and South Africa), India has also experienced an increase in the Agency Index over the period 2007 to 2018. While agency has increased, solidarity has stagnated in India.


China
Improvement except in environment
China has experienced changes in the direction of liberal communitarianism, i.e. low scores in environmental sustainability but rather balanced performance in agency, solidarity and GDP per capita.
China, a middle-income country, shows an increase in the Agency and Solidarity Indexes from 2007 to 2018.
Russia
All selected middle-income countries (Brazil, China, India, Russia and South Africa) have experienced an increase in the Agency Index. Whereas high-income countries tend to exhibit a larger within-country variation in the Agency Index than across-country variation, the opposite is true of the middle-income countries.
While agency increased in all depicted countries, solidarity increased in China and South Africa but stagnated in India, Russia and Brazil.

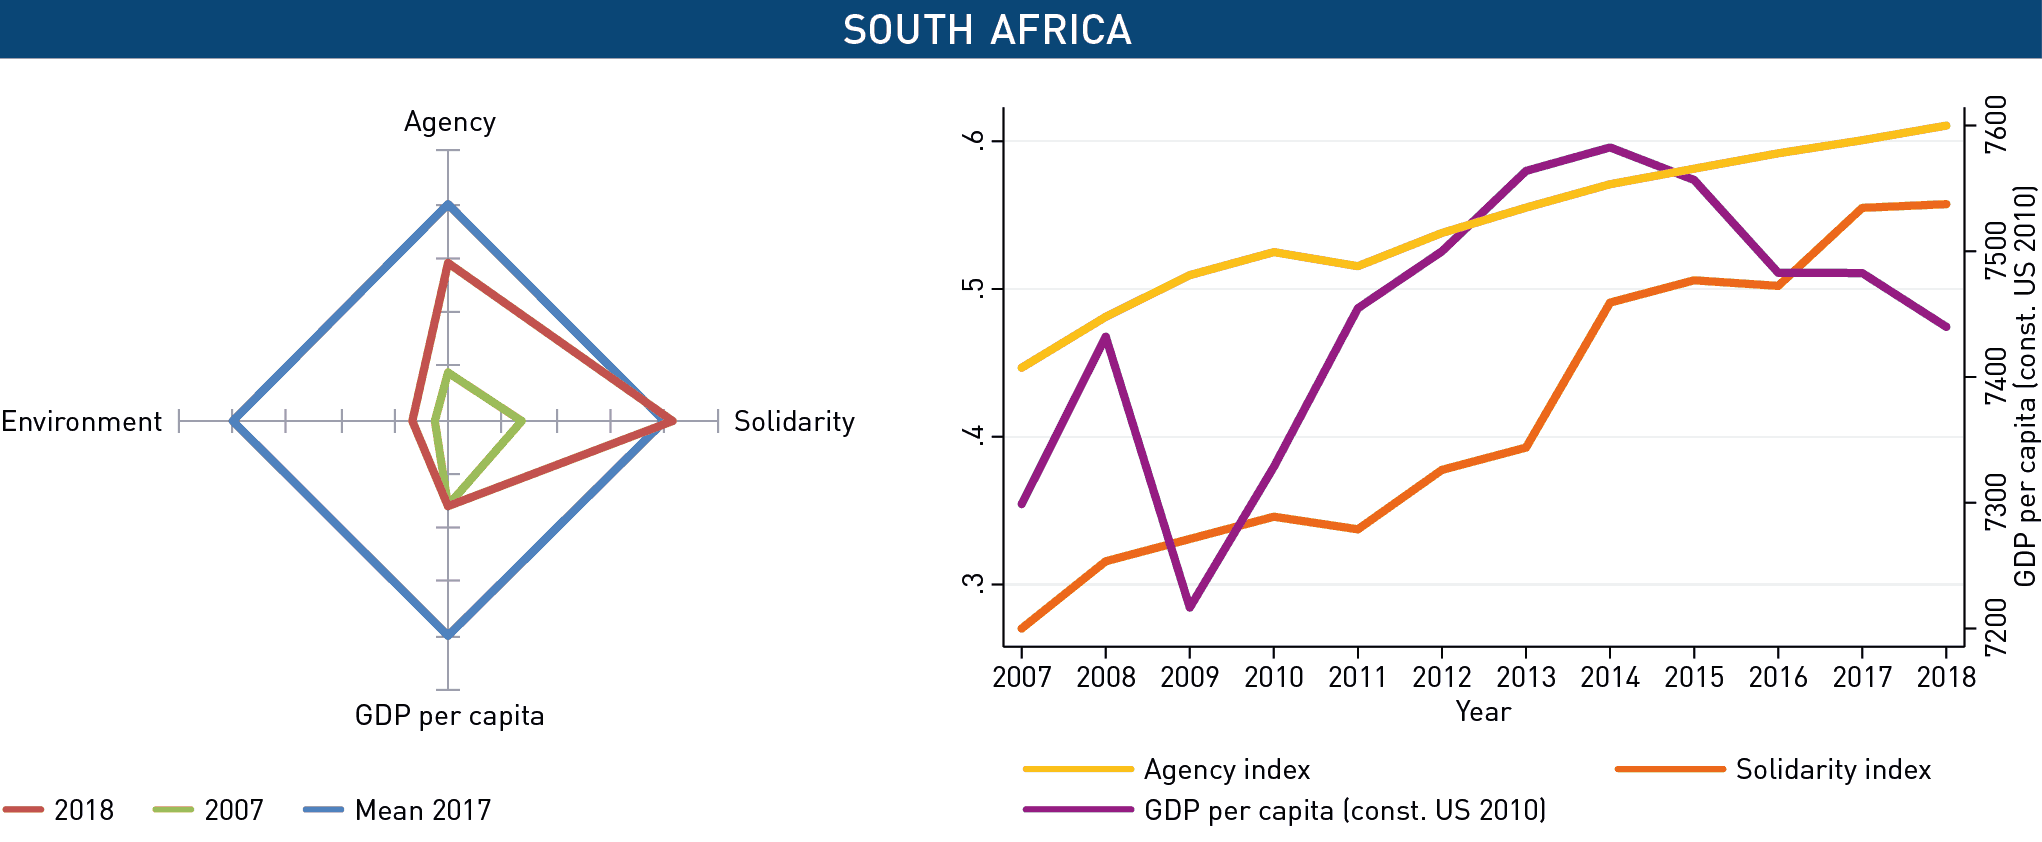
South Africa
South Africa experienced changes in the direction of liberal communitarianism.
South Africa underwent a sharp increase in the agency score. This development was mainly driven by increases in life expectancy and years in education. Also a particularly high increase in solidarity can be observed. The fact that solidarity increased after the 2008 financial crisis suggests that people in this country react with personal contributions.
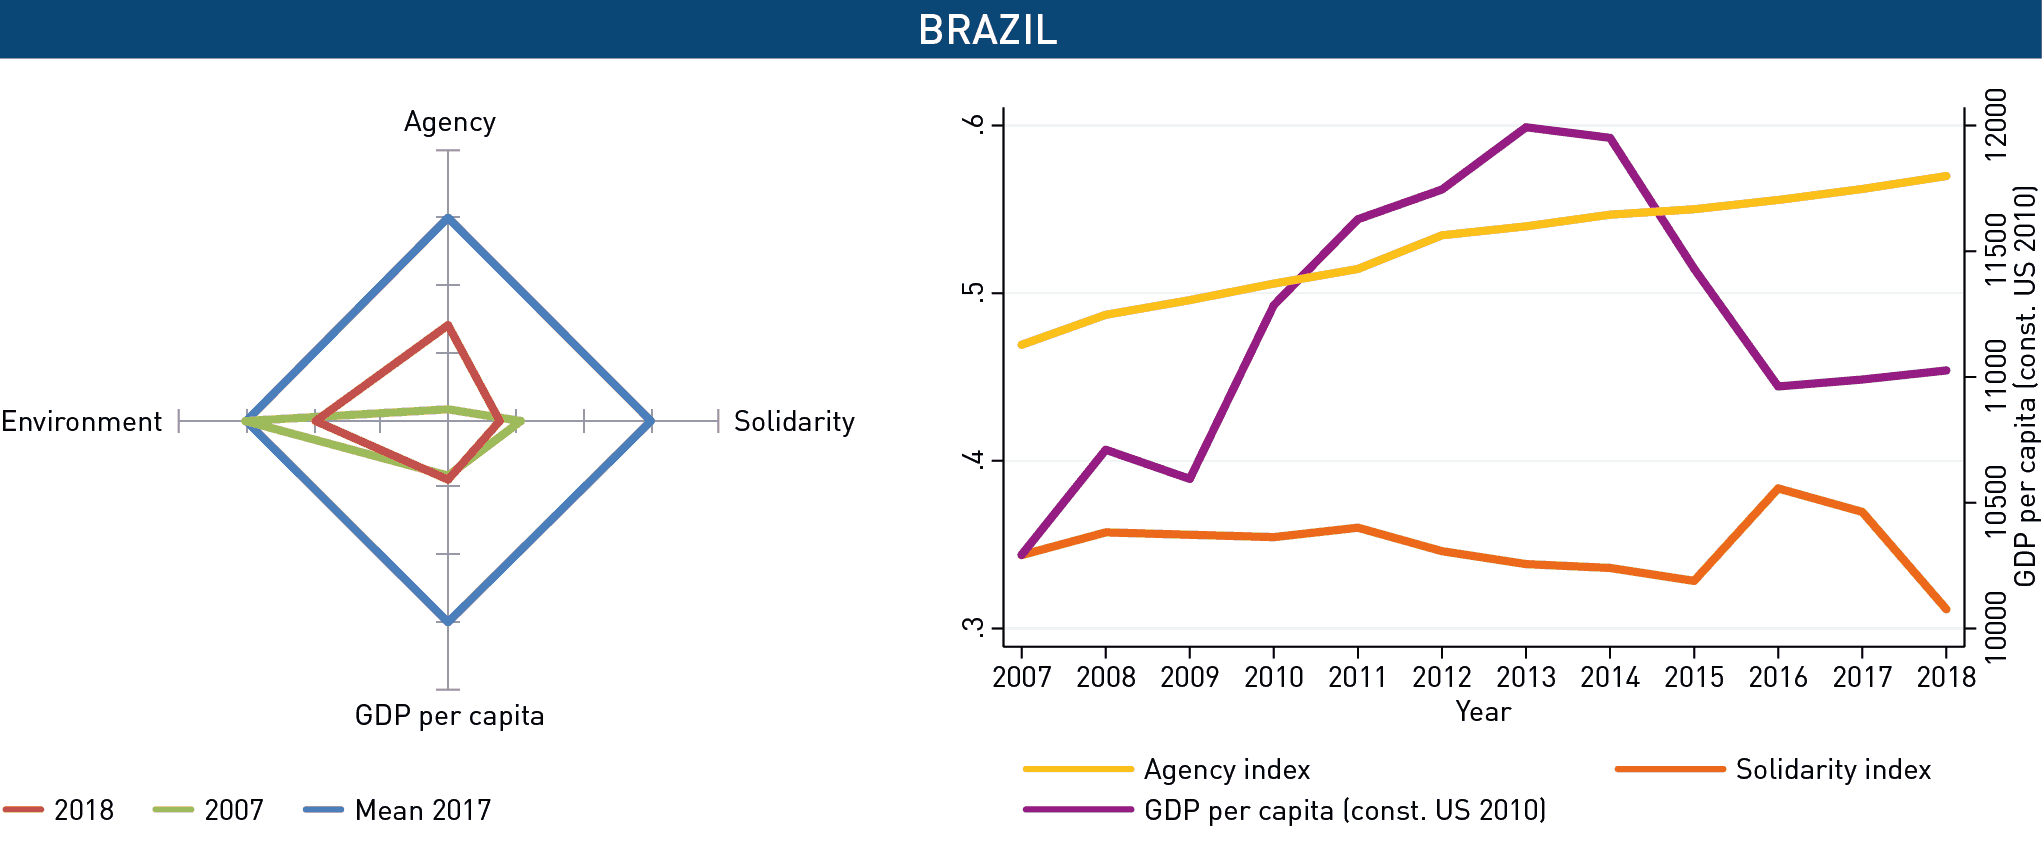
Brazil
The Environmental Performance Index in Brazil decreased, while the country improved slightly in the Agency Index. This development was driven by factors like, years in education in Brazil, as also seen in South Africa. However, solidarity in Brazil experienced a sharp decrease, especially from 2017 to 2018.
Whereas high-income countries tend to exhibit a larger within-country variation in the Agency Index than across-country variation, the opposite is true of the middle-income countries, such as Brazil.