Homepage » Programs » Socio-Economic Transformation: Recoupling Dashboard » Recoupling Dashboard 2020 » Recoupling Dashboard – Material Gain
.
The Recoupling Dashboard: Material Gain
Economists and policymakers have been blindsided by the rise of populism as they mistook non-monetary social phenomena (disempowerment and alienation) for purely monetary phenomena (rising inequality and falling economic mobility). The Recoupling Dashboard shows, however, that GDP per capita and inequality differ from solidarity and agency both in movement over time and comparison across countries.
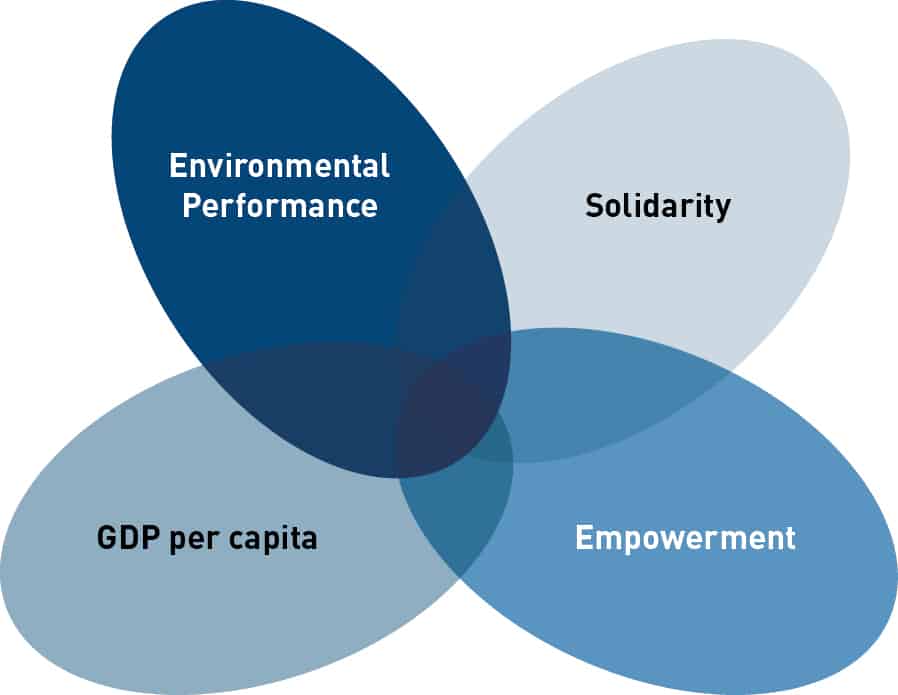
The Recoupling Dashboard resolves the misunderstanding of what constitutes wellbeing and what is driving the decoupling of economic prosperity from social prosperity and environmental sustainability. To do so, GDP per capita – as the standard index of material prosperity for most countries – is incorporated as one of the four dimensions within the Recoupling Dashboard. Material wellbeing also serves a recoupled society when taking into account solidarity, empowerment and environmental sustainability.
Agency and solidarity cannot be adequately covered through a traditional economic focus on GDP
In the last four decades, globalization and technological advances have generated significant growth of the Gross Domestic Product (GDP) worldwide. Globalization and technological progress have largely integrated the global economy, characterized by flexible global value chains.
Globalization has manifested itself primarily through the proliferation of global supply chains, in which multinational enterprises are able to shift production flexibly across geographic regions in response to changes in wages, productivity and business conditions. Technological changes led to a rise in automation and the accompanying shift of routine jobs being done by people to machines.
But in light of the ways in which globalization and technological advances in the new digital age are proceeding, aggregate economic prosperity, agency and social solidarity are not closely aligned with one another. This disconnect is relevant to the recent rise of nationalism and populism: When economic growth primarily benefits people at the top of the income distribution and is accompanied by reduced social and economic mobility, then it is not surprising that people at the middle and lower reaches of the income distribution should feel disempowered and socially alienated.
People working in one geographic region (such as car manufacturing centers like Detroit or Dagenham) find themselves in competition with their counterparts in distant parts of the world (such as Tokyo) of which they have no knowledge. Under these circumstances, the sudden loss of jobs in response to shifts in global supply chains are often experienced as profoundly disempowering, since it is no longer clear how people are able to secure their jobs and future career paths through their own efforts. The associated collapse of local communities, such as those built around traditional manufacturing plants, lead to the breakup of social ties. The rise of automation and the accompanying shift of routine jobs from people to machines generate a similar sense of disempowerment and alienation.
The Recoupling Dashboard argues that agency and solidarity alongside economic prosperity and environmental sustainability cover fundamental human needs and purposes, present in all cultures. When people’s important material needs have been met, when they feel securely and meaningfully embedded in society, when they have the power to influence their circumstances in accordance with self-determined goals, and when they live respectfully of planetary boundaries, then they achieve a wider sense of human wellbeing than when they simply consume goods and services, which maximize GDP growth.
To stop the fragmentation of our societies and to shape a sustainable economy, the Gross Domestic Product as the globally accepted indicator of prosperity results in fundamentally wrong actions by governments and businesses. Human wellbeing is about more than satisfying preferences for the consumption of goods and services. It also includes the pursuit and achievement of value-driven purposes. Measuring wellbeing in the 21st century must also take into consideration social implications and environmental sustainability.
| World Ranking per year | 2018 | 2017 | 2016 | 2015 | 2014 | 2013 | 2012 | 2011 | 2010 | 2009 | 2008 | 2007 | ||||||||||||
| 1 | Luxembourg | $ 107.243 | Luxembourg | $ 106.520 | Luxembourg | $ 107.480 | Luxembourg | $ 107.235 | Luxembourg | $ 105.659 | Luxembourg | $ 103.722 | Luxembourg | $ 102.405 | Luxembourg | $ 105.265 | Luxembourg | $ 104.965 | Luxembourg | $ 101.940 | Luxembourg | $ 108.577 | Luxembourg | $ 111.968 |
| 2 | Norway | $ 92.121 | Norway | $ 91.451 | Norway | $ 90.403 | Norway | $ 90.132 | Norway | $ 89.275 | Norway | $ 88.539 | Norway | $ 88.689 | Norway | $ 87.481 | Norway | $ 87.770 | Norway | $ 88.260 | Norway | $ 90.917 | Norway | $ 91.617 |
| 3 | Switzerland | $ 78.816 | Switzerland | $ 77.452 | Switzerland | $ 76.934 | Switzerland | $ 76.553 | Switzerland | $ 76.411 | Switzerland | $ 75.500 | Switzerland | $ 74.984 | Switzerland | $ 75.030 | Switzerland | $ 74.606 | Switzerland | $ 73.189 | Switzerland | $ 75.794 | Switzerland | $ 75.144 |
| 4 | Ireland | $ 76.881 | Ireland | $ 71.756 | Ireland | $ 67.078 | Ireland | $ 65.433 | Denmark | $ 59.438 | Denmark | $ 58.788 | Denmark | $ 58.488 | Denmark | $ 58.576 | Denmark | $ 58.041 | Denmark | $ 57.229 | Denmark | $ 60.505 | Denmark | $ 61.175 |
| 5 | Denmark | $ 62.931 | Denmark | $ 62.357 | Denmark | $ 61.371 | Denmark | $ 60.402 | Australia | $ 54.706 | Australia | $ 54.137 | Australia | $ 53.673 | Sweden | $ 53.127 | Sweden | $ 52.133 | Australia | $ 51.767 | Sweden | $ 52.773 | Ireland | $ 54.708 |
| 6 | Sweden | $ 57.232 | Sweden | $ 56.611 | Sweden | $ 56.196 | Sweden | $ 55.419 | Sweden | $ 53.619 | Sweden | $ 52.780 | Sweden | $ 52.578 | Australia | $ 52.568 | Australia | $ 52.022 | Netherlands | $ 50.534 | Netherlands | $ 52.728 | Sweden | $ 53.484 |
| 7 | Australia | $ 56.919 | Australia | $ 56.229 | Australia | $ 55.875 | Australia | $ 55.184 | Ireland | $ 52.775 | Netherlands | $ 50.565 | Netherlands | $ 50.781 | Netherlands | $ 51.500 | Netherlands | $ 50.950 | Sweden | $ 49.607 | Australia | $ 51.841 | Netherlands | $ 51.809 |
| 8 | Netherlands | $ 55.023 | Netherlands | $ 53.942 | Netherlands | $ 52.727 | United States | $ 52.099 | Netherlands | $ 51.101 | United States | $ 50.161 | United States | $ 49.596 | United States | $ 48.862 | Ireland | $ 48.715 | Ireland | $ 48.111 | Ireland | $ 51.202 | Australia | $ 51.024 |
| 9 | United States | $ 54.542 | United States | $ 53.356 | United States | $ 52.534 | Netherlands | $ 51.872 | United States | $ 51.015 | Canada | $ 49.400 | Canada | $ 48.788 | Ireland | $ 48.670 | United States | $ 48.467 | United States | $ 47.649 | Finland | $ 49.364 | United States | $ 49.856 |
| 10 | Iceland | $ 52.103 | Iceland | $ 51.282 | Canada | $ 50.264 | Canada | $ 50.280 | Canada | $ 50.309 | Ireland | $ 48.971 | Ireland | $ 48.573 | Canada | $ 48.467 | Canada | $ 47.450 | Canada | $ 46.543 | United States | $ 49.319 | Finland | $ 49.239 |
| 11 | Canada | $ 51.382 | Canada | $ 51.151 | Iceland | $ 50.188 | Austria | $ 47.850 | Austria | $ 47.843 | Austria | $ 47.901 | Austria | $ 48.172 | Austria | $ 48.065 | Austria | $ 46.858 | Austria | $ 46.123 | Canada | $ 48.498 | Canada | $ 48.537 |
| 12 | Austria | $ 50.250 | Austria | $ 49.190 | Austria | $ 48.301 | Iceland | $ 47.405 | Japan | $ 46.484 | Japan | $ 46.249 | Finland | $ 46.278 | Finland | $ 47.171 | Finland | $ 46.202 | Finland | $ 45.066 | Austria | $ 48.053 | Iceland | $ 47.835 |
| 13 | Japan | $ 48.920 | Japan | $ 48.439 | Japan | $ 47.444 | Japan | $ 47.103 | Iceland | $ 45.853 | Finland | $ 45.716 | Japan | $ 45.277 | Belgium | $ 44.594 | Japan | $ 44.508 | Iceland | $ 44.492 | Iceland | $ 47.889 | Austria | $ 47.510 |
| 14 | Finland | $ 48.445 | Finland | $ 47.740 | Finland | $ 46.439 | Germany | $ 45.521 | Finland | $ 45.239 | Iceland | $ 45.421 | Belgium | $ 44.423 | Japan | $ 44.539 | Belgium | $ 44.380 | Belgium | $ 43.591 | Japan | $ 45.166 | Japan | $ 45.687 |
| 15 | Germany | $ 47.502 | Germany | $ 46.988 | Germany | $ 46.168 | Finland | $ 45.316 | Germany | $ 45.132 | Germany | $ 44.355 | Germany | $ 44.259 | Germany | $ 44.125 | Iceland | $ 43.025 | Japan | $ 42.725 | Belgium | $ 44.956 | Belgium | $ 44.961 |
| 16 | Belgium | $ 46.683 | Belgium | $ 46.211 | Belgium | $ 45.599 | Belgium | $ 45.174 | Belgium | $ 44.660 | Belgium | $ 44.302 | Iceland | $ 44.032 | Iceland | $ 43.701 | Germany | $ 41.786 | Germany | $ 40.086 | Germany | $ 42.365 | Germany | $ 41.832 |
| 17 | France | $ 43.664 | France | $ 43.002 | United Kingdom | $ 42.202 | France | $ 41.765 | France | $ 41.478 | France | $ 41.283 | France | $ 41.258 | France | $ 41.329 | France | $ 40.638 | France | $ 40.059 | France | $ 41.456 | France | $ 41.583 |
| 18 | United Kingdom | $ 42.986 | United Kingdom | $ 42.670 | France | $ 42.055 | United Kingdom | $ 41.757 | United Kingdom | $ 41.124 | United Kingdom | $ 40.249 | United Kingdom | $ 39.707 | United Kingdom | $ 39.413 | United Kingdom | $ 39.080 | United Kingdom | $ 38.725 | United Kingdom | $ 40.749 | United Kingdom | $ 41.214 |
| 19 | New Zealand | $ 38.000 | New Zealand | $ 37.678 | New Zealand | $ 37.319 | New Zealand | $ 36.770 | New Zealand | $ 36.175 | New Zealand | $ 35.410 | Italy | $ 34.885 | Italy | $ 35.994 | Italy | $ 35.849 | Italy | $ 35.363 | Italy | $ 37.585 | Italy | $ 38.237 |
| 20 | Italy | $ 35.392 | Italy | $ 35.029 | Italy | $ 34.398 | Italy | $ 33.959 | Italy | $ 33.616 | Italy | $ 33.887 | New Zealand | $ 34.787 | New Zealand | $ 34.217 | New Zealand | $ 33.692 | New Zealand | $ 33.552 | New Zealand | $ 33.962 | New Zealand | $ 34.600 |
| 21 | Israel | $ 34.789 | Israel | $ 34.333 | Israel | $ 33.840 | Israel | $ 33.180 | Israel | $ 32.997 | Israel | $ 32.374 | Israel | $ 31.671 | Israel | $ 31.593 | Spain | $ 30.737 | Spain | $ 30.874 | Spain | $ 32.303 | Spain | $ 32.460 |
| 22 | Spain | $ 33.146 | Spain | $ 32.403 | Spain | $ 31.540 | Spain | $ 30.595 | Spain | $ 29.496 | Spain | $ 29.008 | Spain | $ 29.415 | Spain | $ 30.322 | Israel | $ 30.659 | Israel | $ 29.594 | Israel | $ 29.961 | Greece | $ 30.055 |
| 23 | Portugal | $ 23.738 | Portugal | $ 23.197 | Greece | $ 22.666 | Greece | $ 22.615 | Greece | $ 22.566 | Greece | $ 22.251 | Greece | $ 22.831 | Greece | $ 24.496 | Greece | $ 26.918 | Greece | $ 28.515 | Greece | $ 29.875 | Israel | $ 29.646 |
| 24 | Greece | $ 23.558 | Greece | $ 23.053 | Portugal | $ 22.512 | Portugal | $ 22.017 | Portugal | $ 21.533 | Portugal | $ 21.228 | Portugal | $ 21.353 | Portugal | $ 22.159 | Portugal | $ 22.539 | Portugal | $ 22.129 | Portugal | $ 22.830 | Portugal | $ 22.817 |
| 25 | Czech Republic | $ 23.359 | Czech Republic | $ 22.755 | Czech Republic | $ 21.864 | Czech Republic | $ 21.382 | Czech Republic | $ 20.344 | Czech Republic | $ 19.827 | Czech Republic | $ 19.930 | Czech Republic | $ 20.119 | Czech Republic | $ 19.808 | Czech Republic | $ 19.424 | Czech Republic | $ 20.521 | Czech Republic | $ 20.151 |
| 26 | Poland | $ 16.640 | Poland | $ 15.826 | Poland | $ 15.101 | Chile | $ 14.722 | Chile | $ 14.561 | Chile | $ 14.461 | Chile | $ 14.036 | Chile | $ 13.456 | Hungary | $ 13.092 | Hungary | $ 12.978 | Hungary | $ 13.873 | Hungary | $ 13.732 |
| 27 | Hungary | $ 16.503 | Hungary | $ 15.696 | Hungary | $ 15.032 | Hungary | $ 14.654 | Hungary | $ 14.119 | Poland | $ 13.633 | Poland | $ 13.437 | Hungary | $ 13.347 | Chile | $ 12.808 | Chile | $ 12.227 | Chile | $ 12.554 | Chile | $ 12.256 |
| 28 | Chile | $ 15.130 | Turkey | $ 14.871 | Chile | $ 14.771 | Poland | $ 14.646 | Poland | $ 14.095 | Hungary | $ 13.511 | Hungary | $ 13.197 | Poland | $ 13.225 | Poland | $ 12.600 | Poland | $ 12.126 | Poland | $ 11.802 | Poland | $ 11.322 |
| 29 | Turkey | $ 15.027 | Chile | $ 14.749 | Turkey | $ 14.063 | Turkey | $ 13.853 | Turkey | $ 13.278 | Turkey | $ 12.842 | Turkey | $ 12.039 | Turkey | $ 11.678 | Brazil | $ 11.286 | Brazil | $ 10.595 | Russian Federation | $ 11.088 | Turkey | $ 10.640 |
| 30 | Russian Federation | $ 11.729 | Russian Federation | $ 11.470 | Russian Federation | $ 11.298 | Brazil | $ 11.431 | Brazil | $ 11.951 | Brazil | $ 11.993 | Brazil | $ 11.746 | Brazil | $ 11.628 | Russian Federation | $ 10.675 | Russian Federation | $ 10.220 | Brazil | $ 10.711 | Russian Federation | $ 10.535 |
| 31 | Brazil | $ 11.026 | Brazil | $ 10.990 | Brazil | $ 10.963 | Russian Federation | $ 11.282 | Russian Federation | $ 11.573 | Russian Federation | $ 11.700 | Russian Federation | $ 11.518 | Russian Federation | $ 11.125 | Turkey | $ 10.672 | Turkey | $ 9.976 | Turkey | $ 10.603 | Brazil | $ 10.294 |
| 32 | Mexico | $ 10.385 | Mexico | $ 10.298 | Mexico | $ 10.207 | Mexico | $ 10.037 | Mexico | $ 9.839 | Mexico | $ 9.694 | Mexico | $ 9.691 | Mexico | $ 9.478 | Mexico | $ 9.271 | Mexico | $ 8.948 | Mexico | $ 9.588 | Mexico | $ 9.622 |
| 33 | China | $ 7.755 | South Africa | $ 7.483 | South Africa | $ 7.483 | South Africa | $ 7.557 | South Africa | $ 7.583 | South Africa | $ 7.564 | South Africa | $ 7.500 | South Africa | $ 7.455 | South Africa | $ 7.329 | South Africa | $ 7.217 | South Africa | $ 7.432 | South Africa | $ 7.299 |
| 34 | South Africa | $ 7.440 | China | $ 7.308 | China | $ 6.884 | China | $ 6.484 | China | $ 6.096 | China | $ 5.711 | China | $ 5.325 | China | $ 4.961 | China | $ 4.550 | China | $ 4.133 | China | $ 3.797 | China | $ 3.480 |
| 35 | India | $ 2.104 | India | $ 1.987 | India | $ 1.874 | India | $ 1.752 | India | $ 1.640 | India | $ 1.545 | India | $ 1.469 | India | $ 1.410 | India | $ 1.358 | India | $ 1.268 | India | $ 1.193 | India | $ 1.174 |
Data Source
GDP per capita (constant 2010 US$)
GDP per capita is gross domestic product divided by mid-year population. GDP is the sum of gross value added by all resident producers in the economy plus any product taxes and minus any subsidies not included in the value of the products. It is calculated without making deductions for depreciation of fabricated assets or for depletion and degradation of natural resources. Data are in constant 2010 U.S. dollars. Source: World Bank national accounts data, and OECD National Accounts data files.