G20 countries account for 60–90% of the global production and consumption of fossil fuels. Methane is the second largest source of greenhouse gas emissions, with a substantially higher warming potential than carbon dioxide. Improved standards of measurement, reporting, verification, and certification of methane emissions based on empirical observations can be a relatively simple and low-cost method of reducing greenhouse gas emissions as compared to other measures achieving similar reductions. Such measures are also essential to determine the extent to which switching from oil and coal to natural gas would significantly contribute to the reduction of greenhouse gas emissions.
Challenge
Summary of the problem and its potential effects
Energy transition will require a substantial reduction in greenhouse gas (GHG) emissions from the energy sector. Increasing the share of gas (in preference to other fossil fuels) in primary energy consumption, switching from other fossil fuels to natural gas, and using gas to back up intermittent renewables have generally been considered the fastest and least costly methods of reducing GHG emissions. This is based on the fact that carbon dioxide emissions from the combustion of natural gas are significantly lower than those from oil or coal combustion. However, the credibility of emission reductions based on fuel switching because of the potential methane emissions from the natural gas value chain is doubtful, methane being a more powerful GHG than carbon dioxide. Published academic sources (Alvarez et al. 2018; Howarth 2019) conclude that methane emissions from natural gas, particularly shale gas operations, can result in the GHG footprints of pipeline gas and liquefied natural gas (LNG) being larger than those of coal and oil.
The wider topic of the policy brief
Despite the IPCC Guidelines for National Greenhouse Gas Inventories and the national inventory reports submitted to the UNFCCC, data on methane emissions from oil and gas operations cannot be verified in many countries, while data for emissions from coal operations are even more problematic. It is therefore urgent to upgrade the IPCC Guidelines on the methodologies for measuring and reporting data on fossil fuel methane emissions and to develop a transparent framework for the verification and certification of these emissions. Given that its member countries account for 60–70% of natural gas produced and burned globally, the G20 should agree on and implement a more stringent methane emissions measurement, where reporting verification and certification framework would be a major step towards reducing these emissions.
A particular aspect: Top down or bottom up measurement
It is important to reach an agreement that accurate assessments must include the reconciliation of bottom-up and top-down measurements of methane emissions from the production, transmission, and distribution of fossil fuels, specifically:
- venting and flaring (including the incomplete combustion of methane) from oil and gas production sites, whether operating or abandoned,
- emissions of methane from coal mines (whether operating or abandoned) and associated operations,
- methane emissions from natural gas transmission and distribution operations, including long distance pipelines for import and export of natural gas and the liquefaction, shipping, and regasification operations of LNG trade.
Increasing importance and complexity
In many countries, the accurate measurement of GHG emissions has focused on carbon dioxide. Until recently, methane emissions have not been a significant issue, but this has changed as their contribution to the overall GHG emissions has been recognized to be significant and increasing. Methane emissions are difficult to measure accurately because of the need for continuous monitoring and the distinction between venting (methane emissions) and flaring (largely carbon dioxide, but also potentially methane, due to incomplete combustion). As global natural gas trade by pipeline and particularly LNG have increased over the past decade, these emissions have become more important and their measurement more complex.
Proposal
Summary of the policy recommendations:
The proposal is that the G20 should agree on and support a revision of the current IPCC Guidelines (IPCC 2006, 2019) for the measurement, reporting, verification, and certification (MRVC)[1] of methane emissions from the production of fossil fuels (oil, gas, and coal) and methane emissions from natural gas value chains (from the point of production to the point of use).
The rationale for this proposal is two-fold:
- methane emissions data must be based on empirically collected rather than generalized emission and activity factors;
- using the results from 1. to demonstrate whether total GHG (carbon plus methane) emissions from natural gas are indeed lower than the emissions from other fossil fuels, and thus whether switching to gas from other fossil fuels should be considered a significant contribution to the energy transition in terms of GHG emission reduction. This would also help to identify the least-cost abatement options.
Relevance to the G20
In 2018, G20 member countries produced 59% of the oil, 62% of the gas, and 93% of the coal global production and consumed 78%, 72%, and 92% of the oil, gas, and coal global consumption, respectively (BP 2019). Therefore, even if only G20 countries adopt this proposal, the majority of global emissions would be covered. The share of natural gas in the primary energy consumption of many G20 countries is significant and, in some cases, increasing.[2] Switching from other fossil fuels to natural gas or moving to hydrogen derived from natural gas with carbon capture and storage could be important pathways for energy transition in G20 countries. Accurate documentation of methane emissions is thus important to determine the potential contribution of this pathway to overall GHG emission reduction.
Estimating the extent of the problem and potential remedies
According to the IPCC’s 5th Assessment Report (published in 2010), methane was estimated to account for 16% of the global GHG emissions over 100 years (IPCC 2014, 6).
Figure 1 shows that atmospheric methane levels have risen significantly over the past 40 years, especially since 2010. Data suggest that, by 2020, methane could account for close to 20% of the total global GHG emissions. These data are reasonably accurate and current, in comparison to the data in Figures 2–4, which were the best that could be accessed but should not be regarded with the same degree of accuracy.
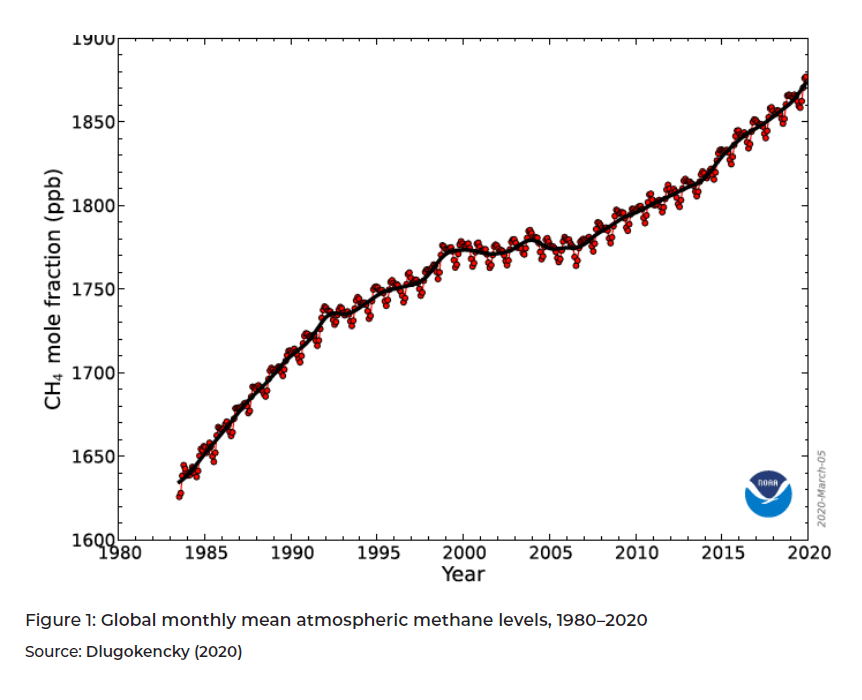
Methane is a very powerful GHG. Over a time horizon of 20 years, the radiative forcing impact of methane—the global warming potential (GWP)—is estimated to be 80–87 times that of carbon dioxide, while over a horizon of 100 years estimates, it ranges from 28–36 times (IEA 2017, 405).[3] Given that scientific reports on the acceleration of climate change suggest the need for more urgent action to curtail emissions, parties to the Paris Agreement (COP21) “… aim to reach global peaking of greenhouse gas emissions as soon as possible…so as to achieve a balance between anthropogenic emissions…in the second half of this century …” (UNFCCC, Paris Agreement, Article 4). However, the European Union has proposed that: “Union-wide emissions and removals of greenhouse gases regulated in Union law shall be balanced at the latest by 2050, thus reducing emissions to net zero by that date” (European Commission 2020, Article 2(1)). We suggest that GHG neutrality for a time horizon of 30 years produces a methane impact 60–70 times that of CO2 (Balcombe et al. 2015, 15).
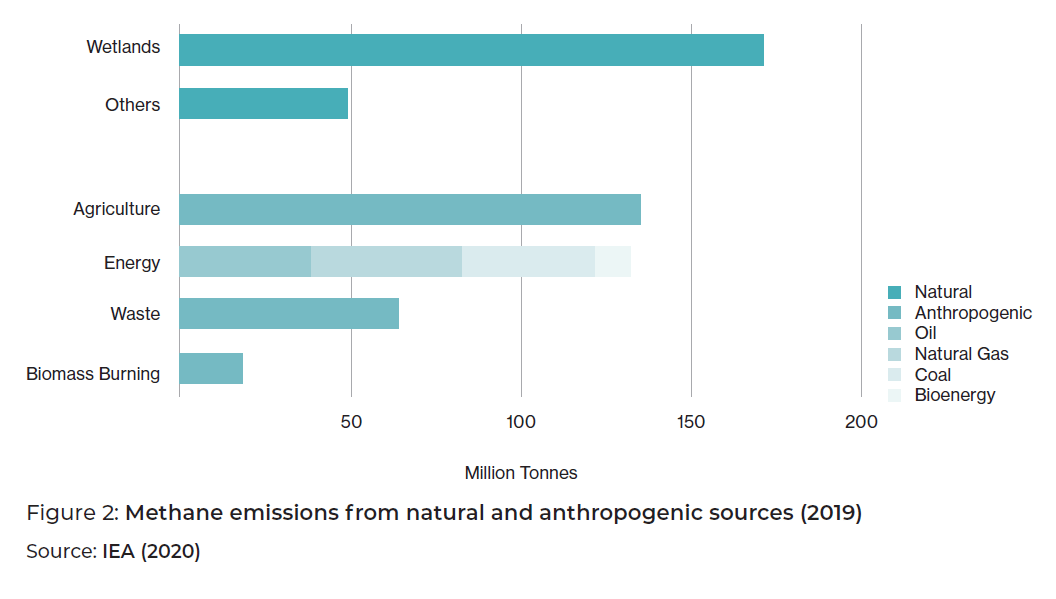
Figure 2 shows global methane emissions from all sources in 2012. Emissions from fossil fuels represent 20% of the global total, but fossil methane emissions may be increasing faster than those from other sources.[4]
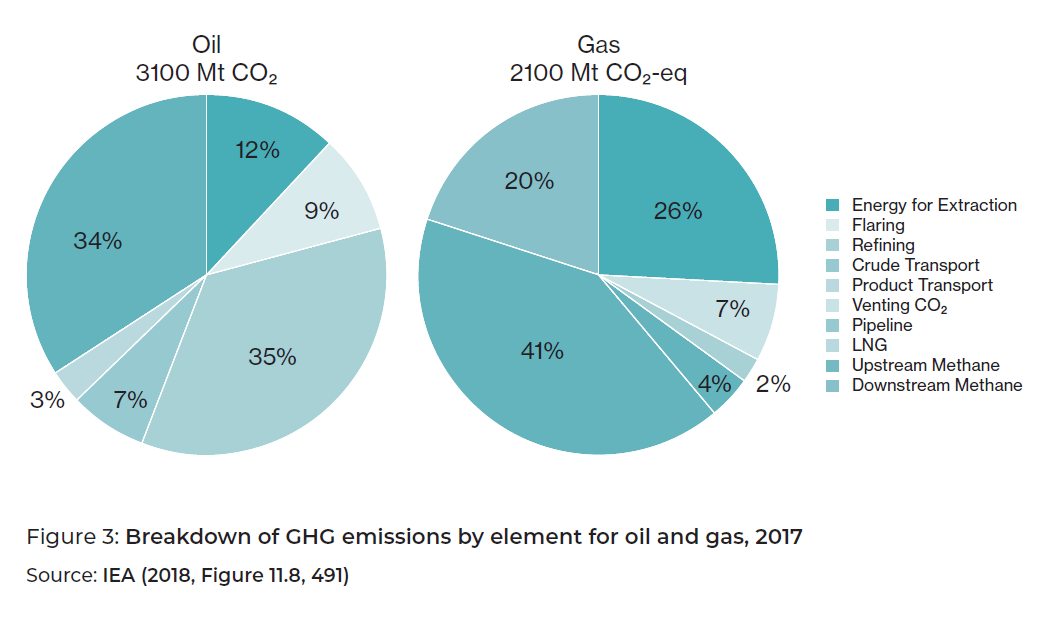
A breakdown of GHG emissions for the different elements of oil and gas operations in 2017 (Figure 3) shows that methane accounted for 34% of total GHG emissions from oil and 61% from gas. In absolute terms, emissions from oil production and processing amounted to 36 mt; while those from gas production, processing, and transportation, a further 43 mt. While these data cannot be considered exact, they have significantly greater granularity than the 2015 estimate of global methane emissions from coal at 40 mt, which the IEA (2017, 417) notes is “subject to a high degree of uncertainty.” We stress the importance of including coal emissions because of the focus in the literature on methane emissions from oil and gas.
The Importance of super-emitters
A detailed analysis of methane emissions from both fossil and natural sources shows the dominance of a relatively small number of “super-emitters.” A study of the US natural gas supply chain found that, on average, the top 10% of gas wells accounted for 70% of the fugitive methane emissions (Balcombe et al. 2017[5]). A two-year study by NASA on Californian (fossil and non-fossil) methane emissions found that one third were from 700 pieces of infrastructure: energy, waste, and agriculture (NASA 2019). It also found that 10% of these sources, considered super-emitters, contributed to the majority of the emissions detected and that super-emitters were responsible for about a third of California’s total methane budget.[6]
Mechanisms for addressing the problem: measurement and reporting
The estimation of methane emissions is highly problematic because of the lack of data and precision about how emissions are measured and attributed. The United Nations Framework Convention on Climate Change (UNFCCC 2020) publishes data reported by governments to the IPCC. The data are of variable quality and believed to be a mixture of top-down and bottom-up calculations.
“Bottom-up” calculations estimate emissions from a representative sample of ground level devices (also drones). They mostly calculate emissions based on activity factors and emission factors, that is, number of gas production sites (activity factor) multiplied by average annual methane emissions per site (emissions factor (EF)).[7] It is a sourcespecific quantification approach, in that the emissions from each identified source are individually calculated.
“Top-down” calculations are carried out on a regional scale using aerial methods; they measure methane concentrations in ambient air and calculate methane flux as a function of meteorological conditions. Top-down studies mainly rely on aircraft flying upwind and downwind of a study area but are also increasingly using satellite data.[8] Each method has its pros and cons but, without temporal and spatial reconciliation, each study type will produce a different result for the same region (Gaffney Cline 2020).[9] Therefore, the aim should be to reconciliate methane emission estimates through a combination of bottom-up and top-down methods.
The 2006 IPCC Guidelines for reporting emissions allowed for a range of estimation methods from generalized activity factors (Tier 1) to detailed models or measurements at individual plant level (Tier 3).[10] However, they contain very little guidance in relation to the different methodologies of data collection. The IPCC updated the Guidelines in 2019 and recognized the difficulties in quantification of fugitive oil and gas emissions, specifically: “A Tier 1 approach is the simplest method to apply but is susceptible to substantial uncertainties and may easily be in error by an order of magnitude or more” (IPCC 2019, 4.39) and, in relation to Tier 3, “The application of rigorous bottomup approaches requires expert knowledge and detailed data that may be difficult and costly to obtain” (IPCC 2006, 4.36). The 2019 guidelines may have been written before aerial—especially satellite—monitoring became a recognized and more common methodology.
IEA’s Methane Tracker publishes data for oil and gas value chains based on standard emission and activity factors for a large number of countries (IEA 2020). Most studies published by NGOs and academic researchers use US oil and gas data as the most detailed and openly available source, some of it being empirically observed or modeled from limited empirical datasets. Some studies then generalize these data across production and value chains in both the US and globally.[11] This is understandable in relation to the paucity of data, but highly problematic in relation to drawing conclusions that can be used to calculate national or global emission estimates. The most complete studies of the methane emissions literature are Balcombe et al. (2015, 2017), which are almost entirely based on US top-down data[12].
Generalizations from limited empirical datasets are particularly problematic in relation to:
- upstream data, which may be derived from a variety of relatively small production sites, compared with those based on much larger single fields.
- older equipment—particularly pipelines and gas gathering infrastructure—which may have far higher emission rates than newer and more technologically advanced equipment.
- Data on methane emissions from coal mining, which are either lacking or fragmentary. Many comparisons of emissions from coal and natural gas compare carbon dioxide emissions from the two fuels, adding methane emissions from gas but failing to include methane emissions from coal.
RVC initiatives and studies
Over the past decade, several different industry and government groups have been set up to monitor and reduce fossil methane emissions, especially from oil and gas. Of these, some of the best known are: the Oil and Gas Methane Partnership Group (of the UN Climate and Clean Air Coalition), Oil and Gas Climate Initiative (OGCI), Collaboratory to Advance Methane Science (CAMS), Global Methane Initiative, and ONE Future.[13]
Many individual members of these groups have made corporate commitments to reduce the emissions of methane (and CO2) within defined time periods and have appointed their own certification organizations to report emissions.[14] While this is a significant step forward, many of these groups focus on upstream emissions and not entire value chains. For natural gas industries, exploration and production-related emissions are only one part of the value chain. National transmission and distribution networks must be included, and for countries with significant involvement in international trade, cross-border gas pipelines, LNG liquefaction, and shipping and regasification terminals must also be included.[15]
In relation to certification, academic and NGO publications tend to conclude that emissions, especially of methane, are substantially higher than reported by industry sources. This means that only transparent, independently certified and published emissions will achieve the required credibility standard. In the European Union, industry bodies are collaborating to develop a value chain approach to methane emissions (Marcogaz 2019). Gas Infrastructure Europe’s Methane Emissions Action Plan covers the entire natural gas value chain—including LNG—involving all main industry associations and the main requirements of data collection and reporting, as well as harmonized methodologies and data quantification (GIE 2019).
Certification of methane emissions from all fossil fuel sources is essential to provide documented evidence whether switching to natural gas does indeed have GHG reduction benefits and quantifies those benefits in relation to specific sources and value chains.[16] We expect no uniform answer to the fuel switching question. In other words, this variance in emissions from individual gas, oil, and coal sources and value chains makes it important to look at specific examples rather than generalizations. For example, if coal is being replaced by gas, there needs to be a comparison of the GHG (CO2 plus methane) footprint of the coal used with the footprint of the gas replacing it. Therefore, IEA (2018, 490) concludes that:
- Over a 100-year time frame, 99.7% of gas produced and consumed today is cleaner than coal when producing electricity.
- Electricity produced from gas that has been transported as LNG results, on average, in 45% lower GHG emissions than coal.
- Over a 20-year time frame, 97% of gas produced and consumed today is cleaner than coal when producing electricity.
However, the above require greater granularity of the different sources of and emissions from individual fossil fuel production sites and value chains.
National data MRVC: Institutions and methods
All countries have established institutions (ministries and/or regulatory bodies) to compile the national inventory reports of GHGs for the IPCC and those data are contained in UNFCCC reports (UNFCCC 2020). The European Commission is considering the creation of a new institution, potentially with a global membership to monitor, report, and verify methane emissions.17 However, this seems to be a high cost option involving the creation of a global bureaucracy, which would replicate many of the functions already carried out by the IPCC and UNFCCC. The IPCC Guidelines provide both decision trees for estimating and worksheets for reporting emissions from oil, gas, and coal.18 In any case, amendments are needed to require all fossil fuel value chain stakeholders to use an upgraded Tier 3 methodology that would require the collection and measurement of methane (and possibly all GHG) emissions using a combination of bottom-up and top-down methods. Moreover, verification and certification must include independent measurement of emissions from data samples. Government institutions will define the rules for data reporting in most countries, but private companies will have a major role in collecting and potentially also certifying the data in many countries (similar to companies that currently certify oil and gas reserves).
Likely costs and benefits of this proposal
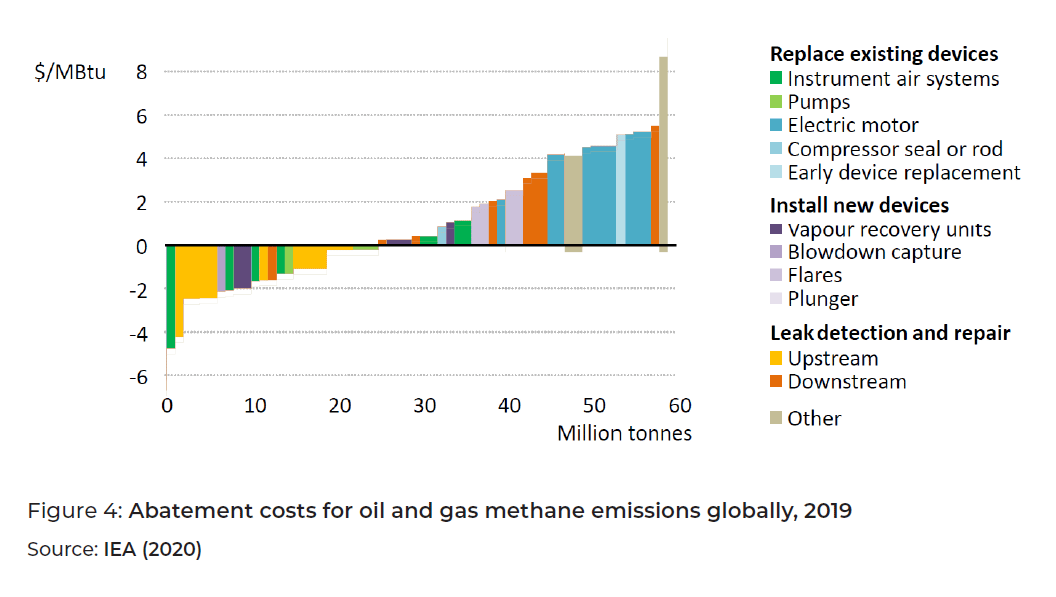
Figure 4 shows a marginal abatement cost curve for the 79 mt of oil- and gas-related methane emissions by mitigation measures.[19] The IEA (2018, 493) estimates that, if all options were to be deployed, this would avoid 75% of these emissions and, at 2017 prices, 45% of those emissions could be avoided at no net cost. The significantly lower gas prices in 2020 will have reduced the 45% figure, but there will still be a significant financial benefit from emissions mitigation, particularly in relation to super-emitters.
The costs related to data collection will depend on whether the measurement method is bottom-up or top-down, the latter being more costly. We hypothesize that the cost of these methods could be as high as tens of millions of dollars for countries with smaller energy systems (but less for countries without significant fossil fuel production) and potentially hundreds of millions of dollars for countries with substantial fossil fuel production. However, not only can costs be offset by the increased utilization of methane (from reduction of emissions), but data collection and certification costs are likely to reduce over time following the initial outlays required to create these systems. It may not be necessary for all countries to create their own top-down collection systems if they are willing to use data from international satellite monitoring initiatives.[20]
IPCC data for 2010 show that methane accounted for 16% of total GHG emissions using a 100-year time horizon. Fossil fuels are estimated at 20% of the total global methane emissions or 3.2% of the global GHG emissions. Therefore, it would be interesting to determine whether increasing efforts to limit fossil fuel methane emissions would constitute a worthwhile contribution to GHG mitigation. The basis of this proposal is that such measures would be worthwhile because recent data show that global methane emissions have been increasing rapidly since 2010 (Figure 1), and this could be a direct result of increases in fossil fuel production. Given the commitments of G20 countries to achieve GHG neutrality as soon as possible (either in the second half of this century or by 2050), there is the case for reducing the 100-year time horizon to 30 years, which would increase the global warming potential of methane from around 30 to around 60–70 times that of carbon dioxide.
A combination of these two factors could raise the figure for both methane as a percentage of total GHG emissions and fossil methane as a percentage of global methane emissions to 7–9%. For countries with substantial fossil fuel production, the share of methane in total GHG emissions is much higher than the global figure.
Key Recommendations
The G20 Governments should agree to:
- change the approved methodologies of data collection for methane emissions from the venting and flaring (incomplete combustion) of fossil fuel production (i.e., oil, natural gas, and coal) and fugitive (leakage of) emissions from natural gas transmission and distribution operations.
- base methodologies on empirical measurement of actual emissions, not generalized emission factors applied to different value chain segments. Data collection should include bottom-up and top-down measurements of emissions, which will need to be reconciled to produce certified assessments. This will require further updating of the IPCC Guidelines for National Greenhouse Gas Emissions Inventories.
- establish a uniform methodology for reporting methane emissions from the different fossil fuels, including natural gas and LNG value chains, from the wellhead to the point of consumption, both nationally and internationally. This should ensure the separation of emissions from oil and gas production and between operating and abandoned oil and gas wells and coal mines.
- establish procedures for the verification and subsequent certification of methane emissions by accredited institutions such as national ministries, regulators, agencies, or accredited national or international private companies. This process must include the measurement of a sample of emissions from relevant facilities by accredited independent institutions.
- focus these efforts on identifying and eliminating “super-emitters” of methane.
- Ensure that the methodologies of collection, reporting verification and certification of data reported to the UNFCCC and the resulting data are transparent and publicly available in the national inventories published by the IPCC.
Disclaimer
This policy brief was developed and written by the authors and has undergone a peer review process. The views and opinions expressed in this policy brief are those of the authors and do not necessarily reflect the official policy or position of the authors’ organizations or the T20 Secretariat.
References
Abrahams, Leslie S., Constantine Samaras, W. Michael Griffin, and H. Scott Matthews. 2015. “Lifecycle Greenhouse Gas Emissions from US Liquefied Natural Gas Exports: Implications for End Users.” Environmental Science and Technology, 49: 3237–45.
Alvarez, Ramón A., Daniel Zavala-Araiza, David R. Lyon, David T. Allen, Zachary R. Barkley, Adam R. Brandt, Kenneth J. Davis, Scott C. Herndon, Daniel J. Jacob, Anna Karion et al. 2018. “Assessment of Methane Emissions from the US Oil and Gas Supply Chain.” Science 361: 186–8.
Balcombe, Paul, Kris Anderson, Jamie Spiers, Nigel Brandon, and Adam Hawkes. 2015. Methane and CO2 Emissions from the Natural Gas Supply Chain: An Evidence Assessment. White Paper 1, Sustainable Gas Institute.
Balcombe, Paul, Kris Anderson, Jamie Spiers, Nigel Brandon, and Adam Hawkes. 2017. “The Natural Gas Supply Chain: The Importance of Methane and Carbon Dioxide Emissions.” ACS Sustainable Chemistry and Engineering, 5 (1): 3–20.
BP. 2019. BP Statistical Review of World Energy.
Dlugokencky, Ed. 2020. Trends in Atmospheric Methane. National Oceanic and Atmospheric Association, Earth System Research Laboratory, NOAA/ESRL. Accessed March 5, 2020. www.esrl.noaa.gov/gmd/ccgg/trends_ch4.
European Commission. 2020. Proposal for a Regulation of the European Parliament and of the Council establishing the framework for achieving climate neutrality and amending Regulation (EU) 2018/1999 (European Climate Law). COM(2020) 80 final.
Gaffney Cline. 2020. “Oil and Gas Monitor, 13th March 2020.” Accessed March 16, 2020. http://gaffney-cline-focus.com/march-13-2020?utm_medium=email&utm_campaign=GCA%20Oil%20%20Gas%20Monitor%20-%20March%2013%202020&utm_content=GCA%20Oil%20%20Gas%20Monitor%20-%20March%2013%202020+CID_ec7d6844d45a5816dc1c16e6b3755c90&utm_source=campaign%.
GIE. 2019. “Methane Emissions Action Plan.” Accessed February 16, 2020. https://www.google.co.uk.
Howarth, Robert W. 2019. “Ideas and Perspectives: Is Shale Gas a Major Driver of Recent Increase in Global Atmospheric Methane?.” Biogeosciences 16: 3033–46. https://doi.org/10.5194/bg-16-3033-2019.
IEA. 2017. World Energy Outlook 2017. Paris: OECD.
IEA. 2018. World Energy Outlook 2018. Paris: OECD.
IEA. 2020. “Methane Tracker.” Accessed March 16, 2020. https://www.iea.org/reports/methane-tracker.
IOGP and Marcogaz. 2020. “Guidelines for Methane Emissions Target Setting, April 2020.” Accessed February 16, 2020 https://www.gie.eu/index.php/gie-publications/methane-emission-report-2019/28274-guidelines-for-methane-emissions-targetsetting/file.
IPCC. 2014. Climate Change 2014: Mitigation of Climate Change. Working Group III Contribution to the Fifth Assessment Report of the Intergovernmental Panel on Climate Change.
IPCC. 2006. IPCC Guidelines for National Greenhouse Gas Inventories.
IPCC. 2019. Refinement to the 2006 IPCC Guidelines for National Greenhouse Gas Inventories.
IPCC. 2020. “Tiers of Emission Factors and Activity Data.” Accessed March 12, 2020. https://community.foundationfootprint.com/FoundationFootprintHelpCentre/Miscellaneous/IPCCTiers.aspx (The full IPCC emission factor database can be found at https://www.ipcc-nggip.iges.or.jp/EFDB/main.php).
LeFevre, C. 2017. “Methane Emissions: From Blind Spot to Spotlight.” OIES Paper 122. Accessed Month Day, Year. https://www.oxfordenergy.org/publications/methaneemissions-blind-spot-spotlight/.
Marcogaz. 2019. “Potential Ways the Gas Industry Can Contribute to the Reduction of Methane Emissions.” Report for the Madrid Forum, June 5–6, 2019.
Nace, Ted, Lydia Plante, and James Browning. 2019. “The New Gas Boom: Tracking Global LNG Infrastructure,” Global Energy Monitor.
NASA. 2016. “Methane Matters.” Accessed Month Day, Year. https://earthobservatory.nasa.gov/features/MethaneMatters.
NASA. 2019. “One Third of California Methane Traced to a Few Super-Emitters.” Accessed Month Day, Year. https://www.nasa.gov/feature/jpl/a-third-of-californiamethane-traced-to-a-few-super-emitters.
National Academic of Sciences. 2018. “Basin Methane Reconciliation Results.” Accessed August 4, 2020. https://energy.colostate.edu/media/sites/147/2018/10/BasinMethaneOverview.pdf.
Nisbet, Euan G., Martin Manning, Ed J. Dlugokencky, Rebecca E. Fisher, David Lowry, Sylvia E. Michel, Cathrine Lund Myhre, Stephen M. Platt, Grant Allen, Philippe Bousquet et al. 2019. “Very Strong Atmospheric Methane Growth in the 4 Years 2014–2017: Implications for the Paris Agreement.” Global Biogeochemical Cycles 33 (3): 318–42. https://doi.org/10.1029/2018GB006009.
OGCI. 2019. Scaling up Action: Aiming for Net Zero Emissions.
Stern, Jonathan. 2017. “Challenges to the Future of Gas: unburnable or unaffordable?.”OIES Paper NG 125.
Stern, Jonathan. 2019. “Narratives for Natural Gas in Decarbonising European Energy Markets.” OIES Paper NG 141.
UNFCCC (2020): National emissions reported to the UNFCCC and to the EU
Greenhouse Gas Monitoring Mechanism. Accessed February 17, 2020. https://www.eea.europa.eu/data-and-maps/data/national-emissions-reported-to-the-unfcccand-to-the-eu-greenhouse-gas-monitoring-mechanism-16.
Zhang, Yuzhong, Ritesh Gautam, Sudhanshu Pandey, Mark Omara, Joannes D. Maasakkers, Pankaj Sadavarte, David Lyon, Hannah Nesser, Melissa P. Sulprizio, Daniel J. Varon et al. 2020. “Quantifying Methane Emissions from the Largest Oil-Producing Basin in the United States from Space.” Scientific Advances 6 (17): eaaz5120.
Appendix
[1] . The usual acronym for this process is MRV—measurement, reporting and verification. However, we use MRVC because, unless emissions are not just verified but also certified, the measurements will not be convincing for the climate community and policymakers.
[2] . In nine G20 countries, the share of natural gas in primary energy consumption exceeds 25% and in only three countries is this share below 10% (BP 2019).
[3] . The IEA uses figures of 85 over 20 years and 30 over 100 years. See IEA (2018, Box 11.3, 490), Balcombe et al. (2015, 16), Stern (2017, Appendix 4), Stern (2019, Appendix A), LeFevre (2017), and NASA (2016).[4] . Howarth (2019) concludes that “methane emissions from fossil fuels are likely exceed those from biogenic sources over the period 2007–17). The increase in emissions from shale gas (perhaps in combination with those from shale oil) makes up more than half of the total increased fossil-fuel emissions.” This study also contains references to a range of other studies, two of which suggest that the increase in methane emissions can be attributed to biogenic sources.
[5] . Table 2 shows data on super-emitters from different parts of the US value chain and processes such as liquids unloading. It also has estimated emissions for Russian gas transmission.
[6] . Of the 270 surveyed landfills, only 30 were observed to emit large plumes of methane. However, those 30 were responsible for 40% of the total point-source emissions detected in the survey. The survey was carried out using planes fitted with an Airborne Visible Infrared Imaging Spectrometer—Next Generation (AVIRIS – NG).
[7] . The IPCC provides three tiers of emission factors and three tiers of activity data. For most countries, only Tier 1 data—default emission factors multiplied by national average production or usage—are available. For details, see IPCC (2020).
[8] . For example, Zhang et al. (2020) use satellite data to quantify methane emissions from the Permian Basin in the United States.
[9] . See Appendix 1 for more details on the pros and cons of each method.
[10] . For detailed definition of the tiers, see Appendix 2.
[11] . An example of this is Nace et al. (2019), who use the emission factors from Alvarez et al. (2018). See also Abrahams et al. (2015). For US studies using both top-down and bottom-up methodology, see IEA (2017, 403–13). Howarth (2019) suggests that North American shale oil and gas production “may have contributed more than half of all of the increased emissions from fossil fuels globally and approximately one third of the total increased emissions from all sources globally over the past decade.” By contrast Nisbet et al. (2019) find that increases in emissions during 2014–2017 resulted mainly from non-fossil sources.
[12] . IPCC’s emission factors are also substantially based on US data from the Environmental Protection Agency (EPA), American Petroleum Institute (API), Gas Research Institute (GRI), and the Bureau of Ocean Energy Management (IPCC 2019, 4.60–4.80).
[13] . Oil and Gas Methane Partnership Group comprises 10 producing companies, the European Union, the Environmental Defense Fund and the United Nations Environment Programme (https://www.ccacoalition.org/en/activity/ccac-oil-gas-methane-partnership); the Oil and Gas Climate Initiative (OGCI) http:// oilandgasclimateinitiative.com/) comprises 13 producing companies; Collaboratory to Advance Methane Science (CAMS) (https://methanecollaboratory.com/); Marcogaz (2019), the technical association of EU gas companies; the Global Methane Initiative (https://www.globalmethane.org) in which 43 countries are involved comprising 70% of global manmade emissions; and ONE Future (http://onefuture.us/) comprises 22 companies from different parts of the gas value chain.
[14]. For example, OGCI (2019, 28) is pledging to reduce the collective methane intensity of its member companies from a 2017 baseline of 0.32%, to below 0.25% by 2025, with the ambition to achieve 0.20%. IOGP and Marcogaz (2020) have set out guidelines for methane emissions target setting. However, many certification organizations seem to be auditing bodies looking at process certification, rather than conducting an independent sampling of actual emissions.
[15]. For an analysis of decarbonization requirements for LNG imports, see Stern (2019).