Given the central role that agriculture plays in the rural economy in developing countries, governments have implemented supply– and demand-side policies and programs to promote sustainable fertilizer use yielding mixed results. Policies typically have not addressed hurdles to fertilizer uptake emanating from highly concentrated fertilizer markets and the related lack of competitive pricing behavior among fertilizers producers and distributors. Fertilizer production worldwide is dominated by few producers. Most developing countries, especially in Africa, rely almost exclusively on imported fertilizer. Locally, fertilizer distribution channels are also characterized by a small number of market actors and poor dealer networks. As a result, fertilizers tend to be expensive and/or difficult to access for many farmers, limiting uptake. The G20 could play a transformative role in improving poor farmers’ access of fertilizers through three main channels: (1) establish a G20-led Global Task Force to Promote Fertilizer Trade and Uptake in developing countries, with special emphasis on Africa; (2) promote the formation of a consortium of multilateral and regional development banks for the creation of a financing facility for investments in new fertilizer plants to increase market competition and reduce fertilizer cost; and (3) mobilize financial support for the elaboration of open-access, detailed soil maps that identify soil classes and soil properties.
Challenge
Agricultural productivity is lagging in some developing regions. Productivity in these regions suffers in part due to the low adoption of improved land management practices, including adequate fertilizer use. Those countries that have successfully increased their agricultural productivity have also considerably increased their use of fertilizer.[1] Boosting yields from 1.5 tons per hectare (t/ha) to 2.0 t/ha is linked to a range of 13 to 19 percent increase in income per capita, a 3.3 to 3.9 percentage point lower share of labor in agriculture five years later, and approximately 20 percent higher non-agricultural labor productivity after roughly one decade.[2] But in Africa south of the Sahara, fertilizer application rates average just 10 kilograms (kg) of nutrients per ha of arable land, compared to 86 kg/ha in South Asia, 118 kg/ha in Latin America, and 198 kg/ha in an average middle-income country.[3] Moreover, even in South Asia and Latin America, the inequality in access to fertilizers is significant.
Given the central role that agriculture plays in the rural economy, several countries have implemented supply– and demand-side policies and programs to promote sustainable fertilizer use, with mixed results. However, not much has been said about the market structure or competitive behavior along the supply chain in the highly concentrated fertilizer industry, nor about how this affects fertilizer uptake. Globally, the industry has only a few producers, and developing countries are highly and increasingly dependent on imported fertilizer. Locally, fertilizer distribution channels are also characterized by a limited number of market actors, often with a poor dealer network.
High levels of concentration in fertilizer production result both from high requirements for raw materials, such as nitrogen, phosphate, and potash, which are not available worldwide, and from economies of scale in production, which generate cost efficiencies for firms (that is, they lower the per-unit costs of production). However, high levels of concentration also create potential for exertion of market power and tacit collusion among firms to the detriment of farmers.
The fertilizer industry is concentrated among a few countries that control most of the production capacity for the primary nitrogen, phosphate, and potash fertilizers[4]. Five countries control more than half of the world’s production capacity for urea (a nitrogen-based fertilizer), DAP/MAP (phosphate-based fertilizers), potash, and NPK (complex fertilizers) (Figure 1). In the case of potash, the top producer countries are home to more than 77 percent of global production capacity in 2008/2009, with Canada and Russia alone responsible for more than half. In the case of urea and DAP/MAP, China, the United States, India, and Russia dominate production capacity. This geographic pattern of fertilizer production is largely determined by the availability of raw materials across the globe.
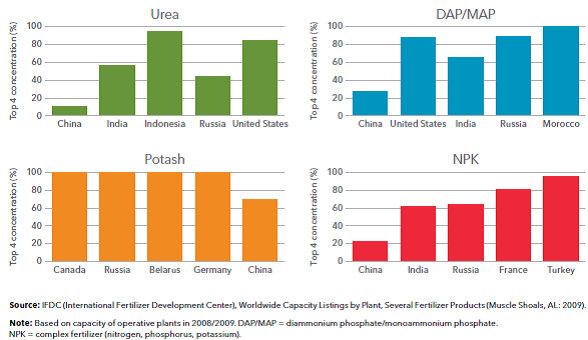
Similarly, the industry is highly concentrated in each of the main producing countries, with the exception of China, in part as a result of the potential for economies of scale in production and the large up-front investments required. Figure 2 illustrates the top-four concentration ratio—that is, the sum of market shares of the four largest producers in a market—for urea, DAP/MAP, potash, and NPK within each of the five major producing countries. In most cases, the top four firms control more than half of each country’s production capacity. Concentration of potash production at the country level is the most extreme case: in four of the five main potash producing countries, the top four firms account for all production capacity. For DAP/MAP and NPK, four of the five main producing countries show a top four concentration ratio above 60 percent, while for urea three countries show a concentration ratio above 50 percent. In some cases, only one company operates in the country—for example, Belaruskali in Belarus and K+S KALI GmbH in Germany for potash, and OCP Group in Morocco for DAP/MAP.
The high levels of concentration observed in the fertilizer industry require policy makers to assess whether promoting competition in these markets would decrease prices, given that market power effects may be outweighing the cost-efficiency effects in the industry. On this matter, a study by Hernandez and Torero (2013) formally analyzes the relationship between fertilizer (urea) prices and market concentration using annual data from a panel of 38 countries. The panel nature of the dataset provides an opportunity to use differences in market structure across countries and time to determine if a positive correlation exists between prices and market concentration, while controlling for other potential factors—essentially, cost factors—that may also explain prices.
Figure 1: Distribution of world fertilizer production capacity (%) by country, 2008/2009[1]
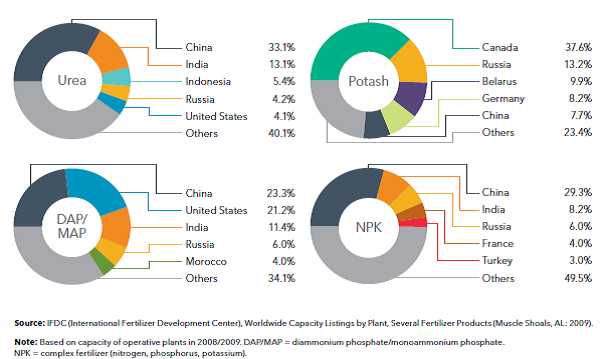
Figure 2: Fertilizer production capacity of top four firms in main producing countries, 2008/2009[2]
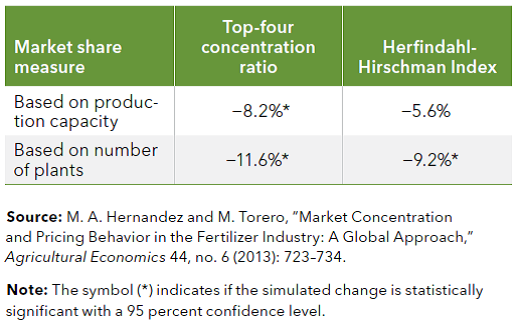
The two standard measures of market concentration used in the study are the top-four concentration ratio and the Herfindahl-Hirschman Index (HHI).[3] Market shares are measured in terms of both production capacity (in metric tons, MT) and number of plants. Both the top-four concentration ratio and the HHI range from zero to one; increases in these indices indicate a decrease in competition (and a potential increase in market power), whereas decreases indicate an increase in competition. The main difference between the two indices is that the HHI places more weight on larger firms.
The analysis reveals a negative correlation between prices and market competition—higher prices are correlated with greater industry concentration. Table 1 shows the estimated change in prices caused by a simulated 10 percent decrease in the level of concentration in the industry, using the top-four concentration ratio and the HHI for both fertilizer production capacity and number of fertilizer plants. A 10 percent decrease in the top-four concentration ratio based on production capacity leads to a decrease of 8.2 percent on average in fertilizer prices, whereas a 10 percent decrease in the top-four concentration ratio based on number of plants would lead to an 11.6 percent decrease in prices. In the case of the HHI, a 10 percent decrease based on production capacity leads to a 5.6 percent decrease in prices, and using the number of plants, to a 9.2 percent decrease in prices, although the former change is not statistically significant at conventional levels.
Table 1: Impact on prices of a 10 percent decrease in concentration
These findings suggest producers and distributors exert market power through price mark-ups along the fertilizer supply chain. Accordingly, one may expect that increased competition would help lower fertilizer prices and uptake. Especially in Africa, this would help increase agricultural productivity and, hence, rural incomes. Any policy designed to promote competition would need to be complemented by institutional reforms, as well as by broader investments in infrastructure, provision of basic public goods, development of market information systems, agronomic research, and studies of market structure and functioning. Overall, policies to promote fertilizer uptake in developing countries are unlikely to be effective if not accompanied by interventions that address flaws in the operation of the market.
In sub-Saharan Africa, tariff and non-tariff barriers to trade in fertilizers and the limited capacity and inefficiencies in ports of entry form additional hurdles. Fertilizer production of urea in Nigeria increased from less than 1 million MT in 2015 to 4 million MT in 2018. This increase would be sufficient to satisfy most of the current demand for fertilizer in the rest of sub-Saharan Africa. However, as a result of prevailing tariff and non-tariff barriers, close to 80 percent of Nigeria’s production is exported to Brazil and Argentina. Trade barriers and market malfunctioning have further led to late delivery, poor product quality control, diversion of product use, theft from government depots, and smuggling of fertilizer to Nigeria’s neighboring countries. In Uganda, in turn, importers and wholesalers are forced to buy at higher prices from other local wholesalers to meet their customers’ needs when there are delays in delivery from suppliers in Kenya.
[1] Obtained from Hernandez and Torero 2017.
[2] Obtained from Hernandez and Torero 2017.
[3] The HHI is the sum of the squared market shares of each firm operating in a market.
[1] Morris, et al. 2007.
[2] McArthur and McCord 2014.
[3] FAO (Food and Agriculture Organization of the United Nations), FAOSTAT, www.fao.org/faostat/en/#home; World Resources Institute, EarthTrends database, www.earthtrends.wri.org.
[4] IFDC (International Fertilizer Development Center), Worldwide Capacity Listings by Plant, Several Fertilizer Products (Muscle Shoals, AL: 2009).
Proposal
Proposal 1. Establish a G20-led Global Task Force to Promote Fertilizer Trade and Uptake in developing countries, with special emphasis on Africa
The task force would work to help prevent restrictions on fertilizer trade between countries and promote competition in the industry at the global level. A main focus of the task force would be to identify measures to improve market access and fertilizer uptake in sub-Saharan Africa and coordinate efforts with regional economic organizations and the African Union.
Proposal 2. Promote the formation of a consortium of multilateral and regional development banks for the creation of a financing facility for investments in new fertilizer plants
The consortium would:
- Undertake joint investment feasibility studies to increase fertilizer production.
- Facilitate the creation of investor consortia (public-private partnerships and foreign investment) for pilot studies to examine alternative mechanisms to increase adequate finance to fund fertilizer production activities and therefore increase competition in the industry and improve access to fertilizers at competitive prices. These studies should also contribute to a better understanding of the competitive behavior along the supply and distribution channel at the regional and local level. The initiative should promote more regional production, including blending plants, with greater investments from major producers and governments or public-private alliances.
- Provide advisory services to build proper institutional designs at regional and country level to improve the governance of the procurement mechanisms for fertilizers minimizing corruption, congestion at the port, and product adulteration.
Proposal 3. Mobilize financial support for the elaboration of open-access, detailed soil maps that identify soil classes and soil properties.
We live in an era of globalization with issues crossing national, international and continental boundaries. Hence, we need global information on soil resources to be able to properly benefit from major access to fertilizers and to optimize the use of land in a sustainable way. Globally, about two-thirds of the countries have soil maps at a 1:1 million scale or finer, but over two thirds of the total land area has yet to be mapped even at a 1:1 million scale. Soil maps depict the distribution of soils on the earth’s surface and have an important role in aggregating our knowledge of soil resources. The maps are based on geographic rules of spatial arrangement of soils and at each scale show soil distribution patterns.
References
- Hernandez, Manuel; and Torero, Maximo. 2017. Promoting Competition in the Fertilizer Industry in Africa: A Global and Local Approach. IFPRI Issues Brief 2018. Washington DC.
- Hernandez, Manuel; and Torero, Maximo. 2013 Market concentration and pricing behavior in the fertilizer industry: A global approach. Agricultural Economics. Agricultural Economics, 44(6): 723-734.
- Morris, M.L.; Kelly, Valerie A.; Kopicki, Ronald J.; and Byerlee, Derek R .2007. Fertilizer Use in African Agriculture: Lessons Learned and Good Practice Guidelines, Directions in Development Series, Agri¬culture and Rural Development (Washington, DC: International Food Policy Research Institute, 2007).
- McArthur, John W. and McCord, C. Gordon. 2014. Fertilizing Growth, Agricultural Inputs and their Effects in Economic Development. Global Economy and Development at Brookings. Washington D.C.