Achieving the SDGs will depend in part on the availability of fiscal resources to deliver the floors in social protection, social services and infrastructure embedded in the goals. A significant portion of these resources is expected to come from domestic sources. Raising additional revenues domestically, however, may leave a significant portion of the poor with less cash to buy food and other essential goods. Fiscal incidence analysis for twenty-nine low and middle-income countries shows that, while fiscal policy unambiguously reduces income inequality, that is not always true for poverty. In other words, the poor are made poorer by the fiscal system, primarily due to consumption taxes. The Domestic Resource Mobilization agenda could make this situation worse. The demand for additional domestic resources must be balanced against the competing need to protect poor households from becoming poorer as a result of taxes.
Challenge
At present, in a number of especially low-income countries a significant proportion of the extreme poor and the vulnerable are net payers into the fiscal system. In other words, the poor are made poorer by the fiscal system, primarily due to consumption taxes. The Domestic Resource Mobilization agenda could make this situation worse. The big risk in setting an ambitious domestic resource mobilization agenda is that in the process governments will tax poor people even further.
To prevent (or, at least, minimize) this negative unintended result from happening, governments need to undertake a comprehensive analysis of who bears the burden of taxes and who benefits from transfers and subsidies, and to raise domestic resources in ways that minimize the impoverishment of the poor. Tax systems need to significantly curb tax evasion and tax elusion by the countries‘ elites, refrain from subsidizing multinational corporations and goods disproportionately consumed by the better-off, and keep consumption taxes on basic goods, if not exempt, as low as possible. Cash transfers will need to benefit the poor and the vulnerable first.
Under Goal One on poverty reduction, there should be a new Target 1.6: “By 2030 to ensure that the fiscal system does not reduce the income of the poor.” In order to achieve this, advanced countries and the multilateral system will need to ensure that resources (through aid and capital flows) and opportunities (through trade and migration policies) are made available to the poor, especially those living in the poorer countries in the world.
Proposal
Introduction
At the UN General Assembly of September 2015, countries around the world committed to achieve the Sustainable Development Goals (SDGs) by 2030.[1] One key factor to achieving the SDGs will be the availability of fiscal resources to deliver the floors in social protection, social services and infrastructure embedded in the SDGs. A significant portion of these resources is expected to come from domestic sources in developing countries themselves, complemented by transfers from the countries that are better off. The conference on Financing for Development in July 2015,[2] for example, set the framework for where the resources to achieve the SDGs and other commitments endorsed in the numerous global and regional compacts will need to come from. Moreover, countries will be expected to set spending targets to deliver social protection and essential public services for all and set nationally defined domestic revenue targets.
As is typical with these exercises designed to identify priorities and commitments which the great majority of countries endorse, the proposals shy away from acknowledging that goals have trade-offs. In particular, that raising additional revenues domestically for infrastructure, protecting the environment or social services may leave a significant portion of the poor with less cash to buy food and other essential goods. Especially in low-income countries, it is not uncommon that the net effect of all governments taxing and spending is to leave the poor worse off in terms of actual consumption of private goods and services.
Fiscal Policy and the Poor
In order to analyze the impact of fiscal policy on income inequality it is useful to separate the “cash portion” of the system. The cash portion includes direct taxes, direct transfers, indirect taxes, and indirect subsidies. The noncash or “in kind” portion includes the monetized value of, for instance, government education and health services. The CEQ Institute[3] results for twenty-nine low and middle-income countries show that, while fiscal policy unambiguously reduces income inequality [4], that is not always true for poverty. In Ethiopia, Ghana, Guatemala, Nicaragua, Tanzania and Uganda, for instance, the headcount ratio for the ultra-poor (i.e., those with incomes below the World Bank’s international poverty line) is higher after direct and indirect taxes net of transfers than for prefiscal income. In these countries, fiscal policy increases poverty, meaning that a larger number of the market income poor and vulnerable are made poorer by taxes and transfers than the number of people who escape poverty.[5] (Table 1)
Table 1 – Fiscal Policy, Inequality and Poverty
| COUNTRY | Change in Gini Coefficient | Change in Headcount Ratio | ||
| Ultra-poor | Extreme Poor | Moderate Poor | ||
| Argentina | -14% | -65% | -35% | 2% |
| Armenia | -7% | -7% | 11% | 14% |
| Bolivia | 0% | -2% | 3% | 4% |
| Brazil | -6% | -36% | -5% | 8% |
| Chile | -6% | -66% | -52% | -24% |
| Colombia | -2% | -25% | -9% | -2% |
| Costa Rica | -4% | -23% | -22% | 3% |
| Dominican Republic | -4% | -14% | 0% | 2% |
| Ecuador | -7% | -54% | -35% | -16% |
| El Salvador | -5% | -16% | -1% | 4% |
| Ethiopia | -6% | 4% | na | na |
| Ghana | -3% | 12% | 9% | 7% |
| Guatemala | -1% | 2% | 5% | 4% |
| Honduras | -2% | -9% | 1% | 5% |
| Indonesia | -2% | -13% | -2% | 0% |
| Iran | -13% | -90% | -75% | -50% |
| Jordan | -5% | -76% | -35% | -8% |
| Mexico | -6% | -35% | -15% | -3% |
| Nicaragua | -4% | 3% | 4% | 5% |
| Paraguay | -2% | -47% | -17% | -10% |
| Peru | -2% | na | -4% | 0% |
| Russia | -7% | -38% | -29% | -12% |
| South Africa | -10% | -43% | -11% | 0% |
| Sri Lanka | -3% | -14% | 1% | 2% |
| Tanzania | -10% | 18% | 6% | 3% |
| Tunisia | -11% | -54% | -25% | 3% |
| Uganda | -4% | 1% | 2% | 1% |
| Uruguay | -6% | -83% | -51% | -22% |
| Venezuela | -5% | -36% | -8% | 2% |
Source: CEQ Data Center on Fiscal Redistribution. Version June 2018. References to individual studies can be found here.
Note: Red font indicates the cases in which postfiscal poverty is higher than market income poverty. The postfiscal headcount ratio is measured with consumable income which is equal to disposable income minus consumption taxes plus consumption subsidies. For definitions see footnote 6.
In addition, to varying degrees, in all countries a portion of the poor are net payers into the fiscal system and are thus impoverished by the fiscal system. The results indicate that, on average, the ultra-poor in Ghana, Nicaragua, Tanzania, and Uganda, the extreme poor in Armenia, Ethiopia, and Guatemala, and the moderate poor in Bolivia, Brazil, Dominican Republic, El Salvador, Honduras, Peru and Sri Lanka are net payers into the fiscal system.[6] (Figure 1) Furthermore, in all countries but two, the vulnerable “strugglers“ (i.e., those with incomes between $4 and $10 dollars a day) are net payers into the fiscal system. While the vulnerable “strugglers“ are above the poverty line, they are still vulnerable to falling back into poverty and hence not part of the secure middle class.[7]
Figure 1 – Net Payers (red) and Net Receivers (blue) to the Fiscal System by Income Group (circa 2010)
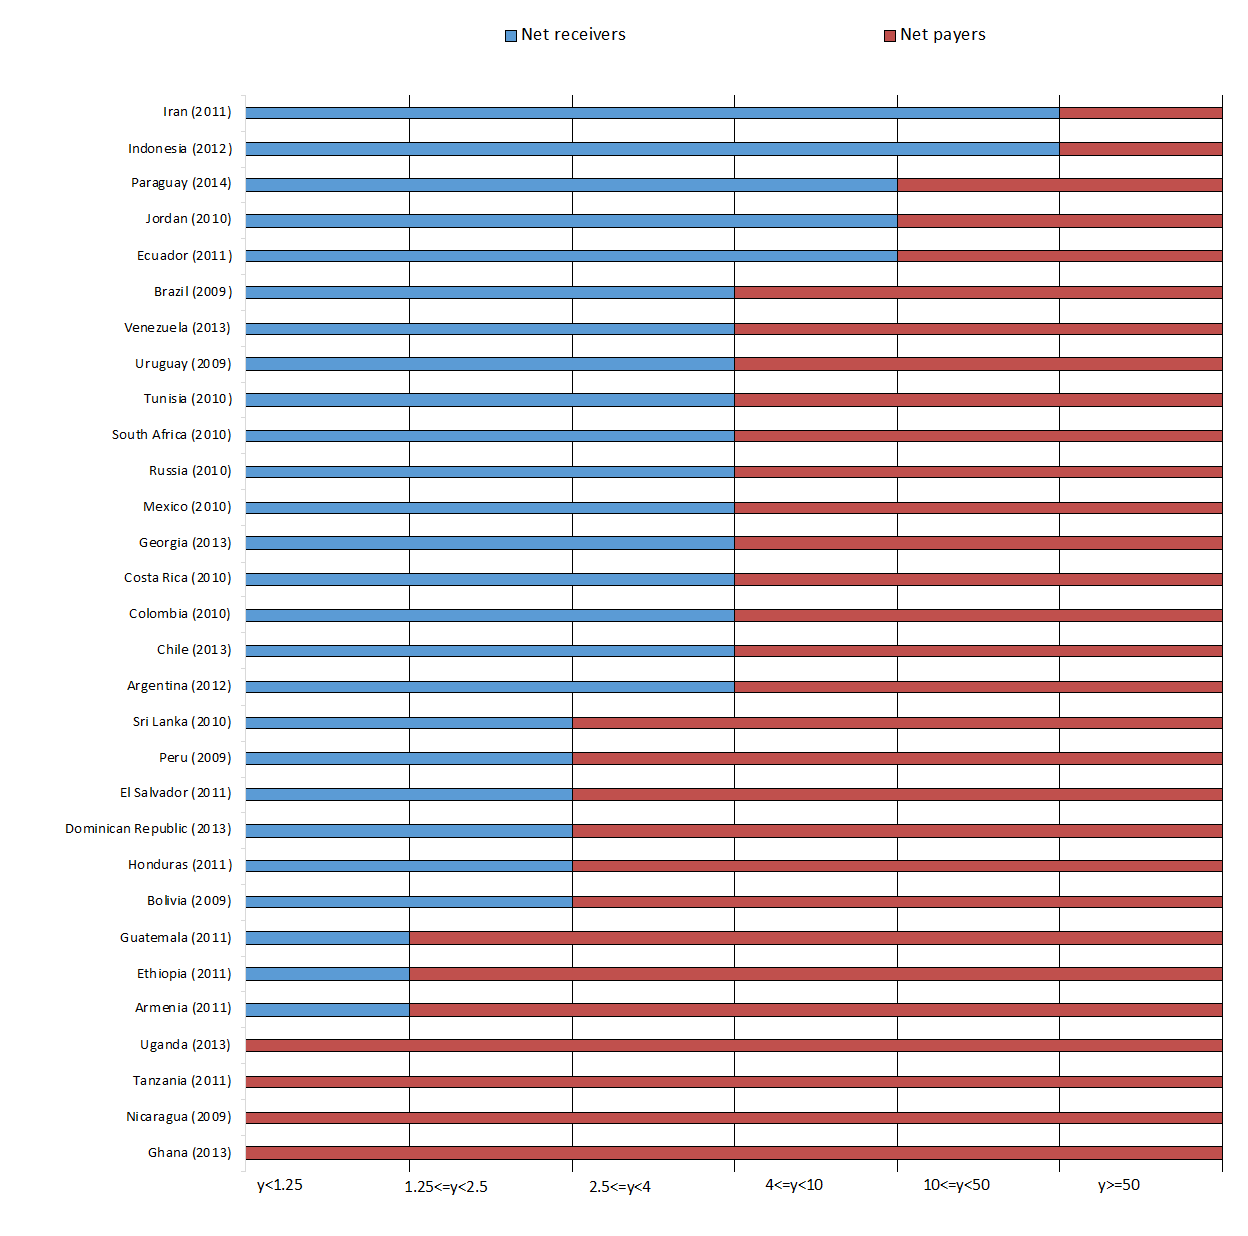
Source: Lustig (2018).
Note: The blue/red bars mean that, on average, individuals in that income group are net receivers/net payers of the fiscal system. The income thresholds, measured in daily purchasing power parity US dollars of 2005, come from Ferreira et al. (2012).
Table 2 presents the proportion of individuals that are fiscally impoverished as a share of the total population classified as poor for eighteen countries for which these calculations were available.[8] In ten countries—Armenia, Bolivia, Brazil, El Salvador, Guatemala, Indonesia, Mexico, Russia, Sri Lanka, and Tunisia—between one-quarter and two-thirds of the postfiscal poor lost income to the fiscal system. In Ethiopia, Ghana, and Tanzania), the proportion of the poor who were impoverished by the fiscal system is staggering: above 75 percent. [9]
Granted, beyond cash transfers and subsidies, taxes are also used to fund education, healthcare, infrastructure, and public goods whose benefits can reach the poor. Public spending on education and health can increase the human capital of the poor. Investment in infrastructure can spur higher growth and, thus, improve the living standards of today’s poor. However, access to education, healthcare and infrastructure are not substitutes for food and other basic necessities the poor need to consume. Malnourished children will not be able to benefit from education, for instance. Hungry workers will not be able to take advantage of employment opportunities. Cash-strapped households may not have the means to pay for transportation to visit the health clinic. That is why the trade-off between raising more revenues domestically to pay for the expansion of education, healthcare and infrastructure and alleviating poverty in the short-run is all too real.
Moreover, in some countries even if we add the monetized value of public spending on education and health (imputed at their government cost to families who report a child attending public school or who report using public health facilities), fiscal impoverishment is still high: in Armenia, Ethiopia, Indonesia, Tunisia, and Russia, between 25 and 50% are still fiscally impoverished when these benefits are included among the transfers. [10]
Table 2 – Proportion of Poor Made Poorer by Taxes and Transfers
| Country (survey year) | Fiscally Impoverished as % of poor | |
| Panel A: poverty line of $2.5/day | ||
| Brazil (2009) | 34.9 | |
| Chile (2013) | 19.2 | |
| Ecuador (2011) | 3.2 | |
| Mexico (2012) | 32.7 | |
| Peru (2011) | 23.8 | |
| Russia (2010) | 34.4 | |
| South Africa (2010) | 13.3 | |
| Tunisia (2010) | 38.5 | |
| Panel B: poverty line of $1.25/day | ||
| Armenia (2011) | 52.3 | |
| Bolivia (2009) | 63.2 | |
| Dominican Republic (2013) | 16.3 | |
| El Salvador (2011) | 27.0 | |
| Ethiopia (2011) | 83.2 | |
| Ghana (2013) | 76.6 | |
| Guatemala (2010) | 62.2 | |
| Indonesia (2012) | 39.2 | |
| Sri Lanka (2010) | 36.4 | |
| Tanzania (2011) | 98.6 | |
Source: Higgins and Lustig (2016).
Note: poverty lines expressed in daily US purchasing power parity dollars of 2005.
This undesirable outcome of the poor being made worse off by the combination of taxes and transfers is the consequence of primarily consumption taxes—e.g., value added or excise taxes. For example, the Brazilian tax system results in heavy taxes on such basic staples as rice and beans. For many households, transfers from Bolsa Familia are not there or are not large enough to compensate what they pay in consumption taxes.[11] This is not the result of a “diabolical” plan: it is the outcome of a very complex cascading tax system and consumption patterns of the poor. In the case of Ethiopia, the fact that many poor were left worse off was a consequence of two factors: the threshold of income at which people were liable to start paying taxes was very low and the Productive Safety Net Program (PNSP)—our flagship cash transfer—was well-targeted but both the coverage and benefit per household were small. In January 2016, the government expanded the coverage of the PNSP to include households living in urban areas, among other things. In July 2016, the government raised the threshold of taxable personal income. While these changes may have not been enough to completely eliminate the problem, it has been an important policy change in the right direction.[12]
Concluding Remarks for the Policymaker
Regarding policy prescriptions, one fundamental lesson emerges: governments should design their tax and transfers system so that consumption of food and other necessities by the poor is not reduced by the fiscal system. This could become an overriding principle in the design of fiscal systems that could be explicitly added to the frameworks proposed by Atkinson (2015) and Stiglitz (2012) to build more equitable societies. Tax systems need to significantly curb tax evasion and tax elusion by the countries‘ elites, refrain from subsidizing multinational corporations and goods disproportionately consumed by the better-off, and keep consumption taxes on basic goods, if not exempt, as low as possible. Cash transfers will need to benefit the poor and the vulnerable first.
Achieving the new Sustainable Development Goals will depend in part on the ability of governments to improve their tax collection and enforcement systems. However, demand for investments into infrastructure and public services must be balanced against the competing need to protect low-income households that may otherwise be made worse off.
The big risk in setting an ambitious domestic resource mobilization agenda is that in the process governments will tax and, thus, impoverish poor people even further. As it stands, the SDGs list of targets would not alert us of such a perverse outcome. Under Goal One on poverty reduction, there should be a new Target 1.6: “By 2030 to ensure that the fiscal system does not reduce the income of the poor.” In order to achieve this, advanced countries and the multilateral system will need to ensure that resources (through aid and capital flows) and opportunities (through trade and migration policies) are are made available to the poor, especially those living in the poorer countries in the world.
[1] For the document endorsed by the General Assembly in September 2015, see United Nations, General Assembly (2015a). The Sustainable Development Goals and their targets can be found here: https://sustainabledevelopment.un.org/?menu=1300.
[2] Document endorsed by the General Assembly of the United Nations on July 27, 2015b (United Nations, General Assembly, 2015b).
[3] Directed by Nora Lustig, the Commitment to Equity (CEQ) Institute works to reduce inequality and poverty through comprehensive and rigorous tax and benefit incidence analysis. For details, please visit www.ceqinstitute.org.
[4] Redistributive success is broadly determined primarily by the amount of resources and their combined progressivity. Net direct taxes are always equalizing. The effect of net indirect taxes is equalizing in nineteen of the twenty-nine countries.
[5] Lustig (2018b).
[6] The definitions are as follows: the ultra-poor are individuals whose income or consumption falls below US$1.25/day; the extreme poor are individuals whose income or consumption lies between US$1.25 and US$2.50/day; and, the moderate poor are individuals whose income or consumption lies between US$2.50 and US$4/day. Income here is measured in 2005 purchasing power parity dollars.
[7] Birdsall, Lustig and Meyer (2014).
[8] To measure fiscal impoverishment table 2 shows indicators for consumable income as the relevant after taxes and transfers income concept. Consumable income equals prefiscal income plus direct transfers and indirect subsidies minus direct and indirect taxes. Although taxes are used to fund more than just direct cash and food transfers and indirect subsidies from the government (e.g., they are used to fund public goods and services, many of which also reach the poor), consumable income is the relevant concept. For example, let’s think of two individuals with exactly the same income in their pockets but who live in different countries. In one country, food is tax exempt while in the other it is subject to a consumption tax (such as the value added tax). Clearly, the amount of actual food the individual in the food-tax-exempt country will be higher than in the country where food consumption is taxed.
[9] Higgins and Lustig (2016).
[10] Ibid.
[11] Higgins and Pereira (2014).
[12] Based on interview with Professor Tassew Woldehanna from Addis Ababa University and member of the CEQ Ethiopia team (CEQ Snapshot No. 2).
References
- Atkinson, Anthony B. 2015. Inequality. What Can Be Done? (Harvard University Press).
- Birdsall, Nancy, Nora Lustig and Christian Meyer. 2014. “The Strugglers: The New Poor in Latin America?,” World Development, August, Volume 60, pp132-146.
- Ferreira, Francisco H. G., Julian Messina, Jamele Rigolini, Luis Felipe Lopez-Calva, Maria Ana Lugo, and Renos Vakis. 2012. Economic Mobility and the Rise of the Latin American Middle Class. (Washington: World Bank).
- Higgins, Sean and Nora Lustig. 2016. “Can a Poverty-Reducing and Progressive Tax and Transfer System Hurt the Poor?” Journal of Development Economics 122, pp. 63-75.
- Higgins, Sean and Claudiney Pereira. 2014. “The Effects of Brazil’s Taxation and Social Spending on the Distribution of Household Income,” in The Redistributive Impact of Taxes and Social Spending in Latin America, edited by Nora Lustig, Carola Pessino, and John Scott, special issue, Public Finance Review 42, 3, pp. 346–67.
- Lustig, Nora. 2018a. “The Sustainable Development Goals, Domestic Resource Mobilization and the Poor.” Chapter 5 in Jose Antonio Ocampo and Joseph Stiglitz, editors. Welfare and Inequality, Columbia University Press, New York.
- Lustig, Nora. 2018b. “Fiscal Policy, Income Redistribution and Poverty Reduction in Low and Middle Income Countries,” chapter 10 in Commitment to Equity Handbook. Estimating the Impact of Fiscal Policy on Inequality and Poverty. Edited by Nora Lustig. CEQ Institute and Brookings Institution Press.
- Stiglitz, Joseph E. 2012. The Price of Inequality. (New York: W. W. Norton and Company).
- United Nations, General Assembly. 2015a. “Transforming Our World: the 2030 Agenda for Sustainable Development.” Resolution adopted by the General Assembly on 25 September 2015. Availabe online at: http://www.un.org/ga/search/ view_doc.asp?symbol=A/RES/70/1&Lang=E
- —. 2015b. “Addis Ababa Action Agenda of the Third International Conference on Financing for Development.” Availabe online at: http://www.un.org/esa/ffd/wp-content/uploads/2015/08/AAAA_Outcome.pdf
- Woldehanna, Tassew. 2017. “Policy Impact of CEQ: Ethiopia.” Interview. CEQ Snapshot No. 2. CEQ Institute.