Despite its significant contribution to greenhouse gas (GHG) emissions, trade can also be a driving force in the move towards a “green” economy and sustainable development. Countries are combining exports with environmental opportunities to support climate policy, economic development, and recovery from COVID-19 pandemic. Trade is a carrier of innovation, enabling low-emission technologies to spread and making global climate goals more achievable. The market price of photovoltaic panels, for instance, has dropped by 85 percent within a decade.
However, green trade is still not as important and free as it could be. Global coordination is needed to assess and define climate friendly products, identify minimal standards that will make production and trade of green goods easier, limit tariffs and non-tariff barriers, include green provisions in free trade negotiations, implement low-carbon oriented regulations and fiscal measures, and decrease distortions in the market, such as fossil fuels subsidies.
Challenge
The world is on track for a temperature rise of at least 2.7°C (UNEP, 2021). Circular economy is the key to unlocking the potential of economic growth and decrease CO2 emissions. Trade has enabled renewable energy sources (RES) to account for 29% of global electricity generation. However, there is still much work to do in other sectors; for instance, in the agri-food sector, which will be affected by both climate change and policies countering it that may contribute to a decline in production and, consequently, an increase in food prices in the long-term (Brenton, 2021).
One of the many problems of the green and climate agenda is that it lacks clarity of what can be assumed as “green”. Global climate negotiations under UNFCCC have moved forward. However, they may not deliver far reaching commitments as they need consensus of all Parties to be put into practice. That is why no global emissions tax or cap-and-trade regime may unfold—instead, countries do it voluntarily. If the majority of countries, especially big emitters, agree to implement a strong economic regime for putting a cost for emissions, the clarification of what is “green” would unfold. This challenge is especially visible when it comes to trade. Which goods are “green”—environmental or climate friendly? Despite several definitions, there is no consensus on the list of products that can be referred as such. There is a list of 54 HS commodity codes that was agreed upon in 2012 at the APEC Forum. There is also a list that is being used by the OECD to account for the value of exports of environmentally friendly products from the 255 commodity codes. The European Commission has a narrow list of technologies connected to the renewable sources. A process of searching for an effective way of identifying “green technologies” is still ongoing.
It is high time that the Environmental Goods Agreement (EGA) be successfully negotiated to promote easier and less costly trade of a wide list of “environmentally and climate-preferred goods” that include not only energy sector, but the whole economy. Action on tariffs needs to be paired with tackling practices that increase pollution, such as a gradual reduction of subsidies for fossil fuels—which account for around $5 trillion a year (de Paula, 2022), other forms of state support that lead to erosion of competition, and incoherent standards that slow down the spread of green products. Even if free trade agreements (FTAs) include environmental commitments, they lack strong enforcement mechanisms. This leads to rent-seeking activities that do not help increase productivity or make production more climate-friendly. Companies and countries become free-riders of the international regime and not investing enough into clean technologies. Stringent policies are threatening competitiveness and risk carbon leakage. Only comprehensive trade agenda may help maintaining fair competition, open borders and achieve climate targets.
Volume of the Green Trade According to the OECD List
The difficulty of defining what constitutes as “green” economy affects assessments of its importance in the world trade. The approach determines how many product groups are classified as those with a positive impact on the environment and climate. Many “green” sectors enable the export of a variety of products, from organically grown fruit to clean and environmentally friendly technologies.
There are several lists that are used to measure green trade. The only one successfully negotiated internationally is the APEC list, which embraces 54 Harmonized System (HS) commodity codes. According to that list, global green trade accounted for about 2.8-2.9 percent of the global trade in 2019-2020 (about $0.5 trillion). However, if we take a much broader list that is proposed by the OECD (Combined List of Environmental Goods, CLEG) we can measure more accurately many different goods that are environmentally or climate friendly. Green trade measured by this approach reached 10.1 percent in 2020 (or $1.7 trillion), despite the pandemic, higher than in 2019 (9.4 percent). Still, not all goods that should be classified as climate or environmentally friendly are included on that list (e.g., car batteries or hybrid cars). Moreover, the six digit HS codes are not very specific and they do include many items that are neither climate nor environmentally friendly. Some technologies might be used in both conventional power plants and renewables (e.g., steam turbines) or in many different sectors (steel constructions for wind farms). Therefore, this assessment might overestimate the value of green trade, but needs broadening as well.
Proposal
Classification of Green Industry and Green Trade
The classification of green trade is derived from the classification of green industry, which covers more industries than the traditional classification of “climate” and “environmental” industries. When it is said that trade is a growth engine especially for the developing countries, trade of environmental or climate goods might not be the case. In general, international trade is cited as a growth engine for the developing countries when they adopt export promotion strategy. However, the exact classification of what we assess as climate and environmental friendly proves for developing countries salient if it might be used to the benefit of developing countries. They export green to a lesser extent high-tech devices, that are often included in the green classifications, than low and medium-tech goods. Therefore, the scope of classification of green industry affects the value of trade and benefits from the trade policies.
Due to the lack of international consensus on the definition of green industry, there are various definitions under the name of climate, environmental, and green industry. Apart from the CLEG list mentioned above, OECD lists the environment-related technologies (OECD ENV-TECH) with the CPC (Cooperative Patent Classification) (OECD, 2020). It is the classification based on green technologies related to climate change mitigation and adaptation technologies (Haščič & Migotto, 2015). Similarly, green industry is defined by using the keywords of 77 green technologies which were designated by the Korean government (Jang et al., 2010; Kang, 2011). The keywords of green technologies were matched with those of industries and the number of citations of patents were counted. Lastly, a broader definition of the Green Goods and Services (BLS GGS) is collected by the U.S. BLS (Bureau of Labor Statistics) that identifies 325 green industries with the NAICS (North American Industry Classification System).
The three classifications mentioned above, except for Jang et al. (2010), show different patterns of the share of global green trade (Figure 1). The values are derived by the code matching between each classification above and the HS 6-digit codes of the UN COMTRADE database (Kang, 2020; Kang and Lee, 2021; Kang et al., 2021). The shares of green exports to total exports by two classifications (OECD ENV-TECH, BLS GGS) in the left axis show similar trend. Two shares tend to decrease until 2013 and increase thereafter. However, the share of green exports by the OECD CLEG (right axis) shows a different pattern with an increasing trend even with slight fluctuations.
Even the values of share of green exports are narrowly defined in the OECD CLEG. Its share of green exports was 5.6 percent (0.108 trillion USD) in 1991 and 7.2 percent (1.316 trillion USD) in 2019. For the same years, the share of green exports was 24.9 percent (0.474 trillion USD) and 22.6 percent (4.122 trillion USD) respectively for the OECD ENV-TECH, and 35.8 percent (0.685 trillion USD) and 32.2 percent (5.868 trillion USD) respectively for the US GGS.
Therefore, the classification or definition of green industry can lead to different conclusions on green trade patterns, leading to different policy recommendations on environmental policy and green trade and thus different reduction policies of GHG emissions.
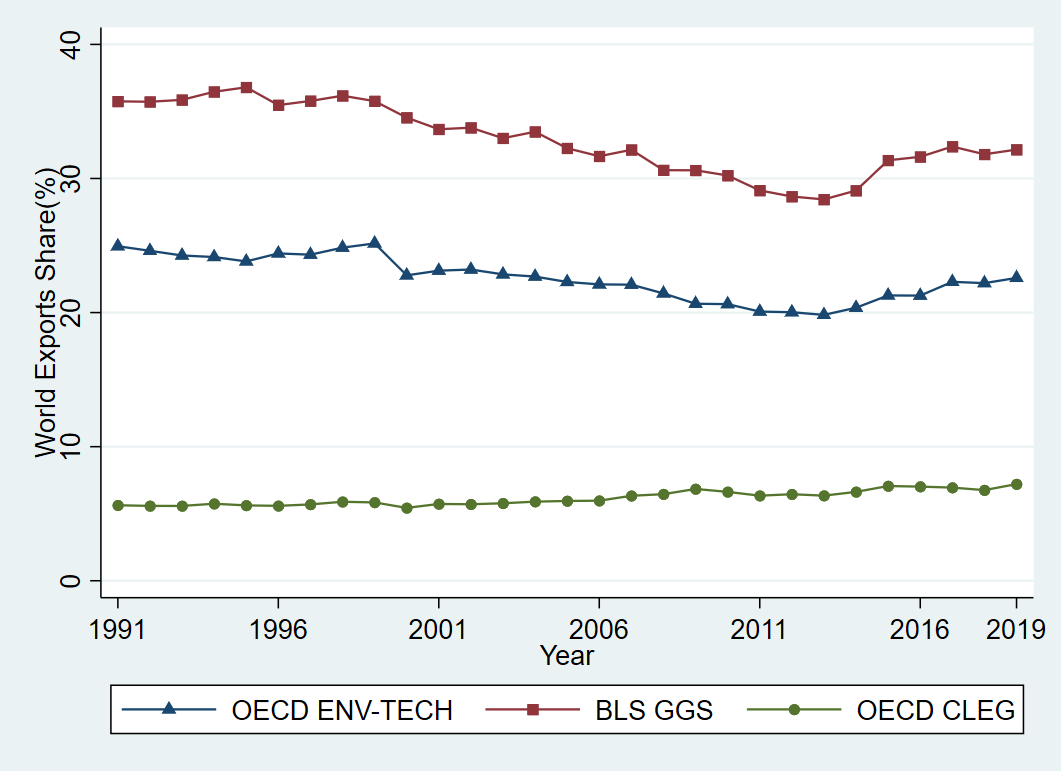
Figure 1: Trend of Green Exports by Green Industry Classification
A new approach is needed to identify the new classification of green products or industries—environmental and climate friendly—that will combine these various approaches and find global recognition. Internationally agreed classification, which could be proposed by the G20 and implemented in WTO negotiated Environmental Goods Agreement (EGA), should include greener substitutes, different kinds of green goods (from food to advanced technologies) that help reduce GHG emissions—either during manufacturing process or its usage. The broadly agreed classification could serve as a basis for negotiating trade policies helping boost green trade—from reducing barriers to mainstreaming green policies.
Trade Liberalization – Tariffs
International negotiators have been dealing with this issue since the WTO Doha Round launched in 2001. There has been an attempt to talk about customs liberalization for trade in green products (Ambroziak, 2015). The only success is to introduce facilitations for the list of 54 commodity codes classified in the HS as related to environmental protection. As it was mentioned before, the list was agreed at the APEC Forum in 2012. The parties decided to reduce customs duties on these groups of goods up to no more than 5 percent of their value. Since 2014, negotiations on an Environmental Goods Agreement (EGA) have been conducted under the auspices of the WTO (Bucher et al., 2014), but no comprehensive agreement, including among smaller group of states, has been reached. Moreover, as in many other international negotiations, the main divide is between developed and developing countries’ interests.
While the former mainly aims to include a narrower scope of technologically-advanced products on the list, the latter would benefit from a very broad approach to green products and the inclusion of goods that are often more environmentally friendly than their substitutes. This kind of list of products, sometimes called “environmentally preferred goods”, would offer less developed countries greater benefits from customs liberalization than the APEC list or the classifications proposed by developed economies as part of the EGA negotiations (de Melo, 2019). The G20 could be a driving force of supporting EGA as an instrument which leads to decisive cuts or even elimination of tariffs on climate-preferred goods which can be beneficial economically and environmentally not only for the biggest economies.
Trade Facilitation – Negotiations of Environmental Standards
To achieve climate and environmental goals related to trade, green goods and services should be more accessible, such as by streamlining certification or by facilitation of logistics. Therefore, basic environmental and climate standards should be forged in the international forum. It can increase productivity of companies, streamline the functioning of global value chains (GVCs), and improve living standards. Efforts in this manner should concern minimum global standards in food production, for example, as it is responsible for nearly 30 percent of GHG emission (WWF proposes in this regard a minimum standards within a project “Codex Planetarius”) or goods connected to RES.
Discussions of abovementioned issues could be initiated within the G20 as the leading importers engaged in GVCs, and by its gravity encourage other countries to participate in making global rules. To this end, a wide array of participants should be engaged to make the standards effective. Thus, as part of WTO’s reform, strengthening of the Committee on Trade and the Environment (CTE), which is responsible for studying the relationship between trade and the environment, could be helpful. Actions should embrace, among others, increasing financial and experts potential, as well as prioritizing discussions on CTE’s proposals among WTO Member States and making sustainability one of the organization’s main goals.
Concurrently, different situations in particular countries, especially developing ones, have to be taken into account to bring them on board. It should result in some differentiations in implementing environmental standards as well as technical and financial support from the developed states. Moreover, to have a broader picture and identify solutions for challenges, such as easing intellectual property rights (IPR) in some areas, representatives from civil society groups, business, and international organizations (e.g. labour unions) should be more engaged in the discussions. Along with CTE, other forums can be used, such as Trade and Environmental Sustainability Structured Discussions (TESSD), which has been functioning since 2020 and embraces half of WTO members.
Strengthening Technical Capacity to Address TBTs
Different technical regulations, standards, and conformity assessment procedures among different countries regarding green products or manufacturing processes might become a challenge. This is not only a barrier to trade, but regulatory and standards disparities also lead to chaos that hampers efforts to promote green manufacturing and green goods. Unification or harmonization of approach towards green trade is incremental to promote environmental and climate friendly industry all around the world. What is more, policy makers shall gain technical capacity to better understand how various Technical Barriers to Trade (TBTs) bring challenges to the green trade and how to form policy measures to address them. They shall also assess the impact of environmental stringency on international trade in climate change industries to balance growth and achieve environmental targets.
The problem is that TBTs in green trade are relatively new and unfamiliar, especially for developing countries. Some policy makers do not have the sophisticated capacity needed to understand the impacts of these TBTs and develop instruments to solve them. When unilateral climate policies to protect domestic industries by specific countries affect international trade, they should be considered in relation to WTO norms (Pak, 2022). In this regard, some climate-friendly regulations like the EU Carbon Border Adjustment Mechanism (CBAM) and US carbon border tax might become a difficult barrier for countries with lower capacity to develop such policies or implement them in their trade strategy. Assistance is needed not to hamper development agenda by moving forward with green policies.
In addition, to promote green trade and thus economic growth of the developing countries, the “sustainomics” concept by Munasinghe (1995) will be helpful. He suggests that international cooperation between developed and developing countries will lead to GHG emissions reduction even if they maintain the same amount of production. The main tools of international cooperation will be financial and technical supports through measures such as FDI, ODA, and PPP. Moreover, in order to keep international trade competitiveness with the protectionist stance of the TBT, developing countries should prepare an institutional basis to create a sustainable industrial ecosystem through investment in decarbonization, renewable energy infrastructure, and low carbon technology R&D.
Strong and Effective Green Component in FTAs
Currently, free trade agreements that encompass environmental as well as social provisions are often labelled as “ambitious”. However, these elements should become essential parts of every future FTA. Moreover, existing deals could be upgraded, such as regarding meeting the goals of the Paris Agreement on climate change and other international environmental agreements. There are examples of bilateral and multilateral agreements that can be treated as templates in the context of environmental solutions, such as the EU-Vietnam Free Trade Agreement (EVFTA) or Comprehensive and Progressive Agreement for Trans-Pacific Partnership (CPTPP). For example, EVFTA embraces requirements for conservation and sustainable use of biological diversity, management of forest resources, and reduction of non-tariff barriers to trade and investment in renewable energy.
One of the latest examples is an Agreement on Climate Change, Trade and Sustainability (ACCTS). The negotiations were initiated by a group of countries (New Zealand, Costa Rica, Fiji, Iceland, Norway and Switzerland) in 2019 with the ultimate goal of combining climate, trade, and sustainable development provisions. The deal could embrace such elements as removal of barriers to environmental goods and services, binding commitments regarding limitation and ultimate elimination of fossil fuel subsidies, and promoting eco-labelling programs and mechanisms. What is important is that it should be a “living agreement” so it can be modified in case of emergence of new technologies or scientific research regarding climate change.
These kinds of plurilateral agreements should be promoted by the G20 in the WTO forum to attract other parties and make the scope of the deal wider. As developing states are the most endangered by climate change there should be avenues in newly created FTAs to support them, among others, by promoting transfer of sustainable technologies and increasing access to IPR concerning environmental solutions. Moreover, the G20 can engage in creating monitoring systems of coherence between trade and environmental policies under FTAs, which is being developed by OECD, among others. In case of violation of environmental provisions there should be a possibility of putting the whole FTA on hold.
Mainstreaming Green Technologies – Phasing Out Fossil Fuels
Trade policies should be designed to address environmental challenges and as instruments to promote green transformation. Recently, the global increase in energy commodity prices caused by the Russian invasion of Ukraine shows that that oil, gas, and coal dependence could be a tool of destabilization and cause price increases for consumers. Transition to RES could ensure not only the achievement of environmental objectives but also socio-economic stability. It also strengthens resistance to energy blackmail, which may be used by authoritative regimes rich in fossil fuels.
The crucial challenge of tackling the climate crisis is how to reduce carbon emissions and phase-out fossil fuels. While comprehensive climate policies like climate tax, cap-and-trade mechanisms are most important, green trade policies might help this transition on an international level. There are many mechanisms that can be used to stimulate green trade—one of the most widely discussed is the carbon tax in trade. The European Union has plans to introduce the CBAM in coming years. Such regulations are in compliance with WTO law, but this is a politically difficult issue as it will hit certain economies, especially developing countries. In the case of the EU regulations, imports from Russia, Turkey, Ukraine, and China would be the most affected. The real key, however, is the degree to which US, China, India, Russia, and Japan decarbonize, because those countries account for the largest proportion of global GHG emissions.
Therefore, while strengthening the climate trade agenda, it is important to develop joint decisions and mechanisms in the international forum to protect the most vulnerable developing countries. Developed countries should provide various supports (e.g., technical and financial) to enable developing countries to reduce carbon emissions. The G20, which embraces such fossil-fuel reliant economies as China and India, can pave the way for advancement in this regard.
Mainstreaming green trade on an international level should be focused also on selected liberalization of trade in green goods and the use of sustainability standards throughout value chains. For example, government procurements in G20 states should include climate assessment and development of evaluation mechanisms and measurement of green trade (some modifications of product lists are needed, as well as broader use of statistics based on input-output tables). At the same time regulations on green investment should be facilitated as well as international cooperation such as on climate-smart agriculture.
There are several recommendations to make international trade “greener” with the involvement of G20, such as:
- To complete negotiations on the Environmental Goods Agreement (EGA) enhancing a wide list of “environmentally and climate-preferred goods” that include various sectors of the world economy, such as “greener” substitutes, different kinds of green goods (from food to advanced technologies). This internationally agreed classification could be proposed by the G20 and serve as a basis for negotiating policies supporting green trade’s development;
- These negotiations would lead to non-discriminatory trade policy, mainly further tariffs reductions of green goods. It should take into account least-developed countries’ interests on a wider scale;
- Forge basic environmental and climate standards (e.g., in food production or RES);
- Strengthen bodies within WTO such as the Committee on Trade and the Environment or Trade and Environmental Sustainability Structured Discussions to engage a wide scope of states as well as civil society groups, business, and international organizations;
- Tackling practices that increase pollution, such as gradual reduction of subsidies for fossil fuels and other forms of state support;
- Stronger environmental commitments in FTAs with an inclusion of an effective monitoring systems and enforcement mechanisms as well as upgrading existing deals on the basis of, for instance, goals embedded in the Paris Agreement on climate change and other international environmental deals;
- Ease the transfer of technologies and IPR regarding environmental solutions to developing countries, especially those that are mostly affected by climate change;
- Implementation of new financial and technical instruments to stimulate green trade, such as carbon tax;
- Involvement of climate policy practices in internal affairs, such as inclusion of climate assessment within a process of government procurements.
References
Ambroziak, Ł. (2015), Handel międzynarodowy towarami zielonymi, „Unia Europejska.pl”, nr 6 (235).
Brandi, C. (2012), Green trade for sustainable development? risks and opportunities on the road to a green economy, Bonn, https://www.die-gdi.de/en/the-current-column/article/green-trade-for-sustainable-development-risks-and-opportunities-on-the-road-to-a-green-economy-1/ [accessed: 30.11.2020].
Brenton, P., Chemutai V. (2021). The Trade and Climate Change Nexus: The Urgency and Opportunities for Developing Countries, World Bank https://openknowledge.worldbank.org/handle/10986/36294
Bucher, H., Drake-Brockman, J., Kasterine, A., M. Sugathan (2014), Trade in Environmental Goods and Services: Opportunities and Challenges, International Trade Centre Technical Paper, Geneva.
de Melo J., Solleder J-M., The Trade and Climate Change Nexus: The Urgency and Opportunities for Developing Countries, VoxEU, (2019), https://voxeu.org/article/what-s-wrong-wto-s-environmental-goods-agreement
de Paula N., Trade and the Environment: The Search for Sustainable Solutions, Policy Brief no 32, 2022, IISD Earth Negotiations Bulletin, https://www.iisd.org/system/files/2022-01/still-one-earth-trade-environment.pdf
Ivan Haščič and Mauro Migotto, “Measuring Environmental Innovation using Patent Data”, OECD Environment Working Papers 89, OECD Publishing, 2015.
Jehan Sauvage, “The Stringency of Environmental Regulations and Trade in Environmental Goods”, OECD Trade and Environment Working Papers 2014/03, 2014.
Jin-gyu Jang, Jae-eok Lee, Gi-cheol Jeong, Ji-young Seo, Hee-jong Kang, Seon Young Lee, Geon-woo Park, and Dong-min Cha, An Analysis of Properties and Capabilities of Eco-Innovation and Policy Recommendations, Science and Technology Policy Institute: Sejong, Korea, 2010. (In Korean)
Mohan Munasinghe, “Making Growth More Sustainable”, in Ecological Economics, Vol. 15 (1995), p.121-124.
OECD (Organization for Economic Cooperation and Development), “Green Growth Indicators”, 2020, https://www.oecd.org/env/indicators-modelling-outlooks/green-patents.htm.
OECD, “Trade and the environment”, https://www.oecd.org/trade/topics/trade-and-the-environment/ .
Pak, Hyomin, “Compatibility of EU Carbon Border Adjustment Mechanism (“EU CBAM”) with the WTO TBT Agreement: Exploring the link between the environment, technology and TBT Agreement,” Legislation, Korea Ministry of Government Legislation, (2022), pp.221-251(in Korea).
A. Sands, Trade, climate change, and environmental standards: What’s next?”, Trade Finance Global, 16 February 2022, https://www.tradefinanceglobal.com/posts/trade-climate-change-and-environmental-standards-whats-next/
Simon J. Evenett and John Whalley, “The G20 and Green Protectionism: Will We Pay the Price at Copenhagen?”, in The Center for Intenatioanl Governance Innovation, No.14 (April 2009).
Sung Jin Kang and Sun Lee, “Impacts of Environmental Policies on Green Trade”, in Sustainability, Vol.13 (2021), p.1-15.
Sung Jin Kang, “Green Trade Patterns and the Transboundary Transmission of Greenhouse Gas Emissions”, in Asian Development Review, Vol.37, No. 1 (2020), p.119-139.
Sung Jin Kang, Sun Lee, and Seon Ju Lee, “Impacts of Environmental Agreements on Bilateral Trade of Climate Industry”, in Energies, Vol.14, No.21 (2021), p.1-17
Sung Jin Kang, “Economic Spillover Effects of Green Industry” in Green Growth: Green Industry and Green Job, National Research Council for Economics, Humanities and Social Sciences, 2011, p.123-154.
WTO (World Trade Organization), Technical Barriers to Trade, WTO, 2014 (The WTO Agreements Series).
WTO, “The environment: a specific concern”, https://www.wto.org/english/thewto_e/whatis_e/tif_e/bey2_e.htm
UNEP, 2021, The Emissions Gap Report 2021: The Heat Is On, https://www.unep.org/resources/emissions-gap-report-2021
UNEP-2, 2021, Greening the Trade: Pathways Forward
Appendix
The appendix tables are to show general trends of green trade (exports, imports) between G20 and non-G20 countries.
Below Figure 2 to Figure 5 show the shares of green bilateral exports from G20 to G20, G20 to Non-G20, Non-G20 to G20, and Non-G20 to Non-G20, respectively using the 3 types of the green industry classification. The members of the G20 are Argentina, Australia, Brazil, Canada, China, France, Germany, India, Indonesia, Italy, Japan, Republic of Korea, Mexico, Russia, Saudi Arabia, South Africa, Turkey, the United Kingdom, the United States and full members of the European Union.
Figure 2 shows the trends of bilateral exports share between the G20 countries. The OECD ENV-TECH and U.S. GGS shares are 27.4% (0.332 trillion USD) and 36.5% (0.442 trillion USD) in 1991, respectively, but decreased slightly to 26.3% (2.827 trillion USD) and 32.2% (3.459 trillion USD) in 2019, respectively. For same period, when using the OECD CLEG classification, the share of green exports between the G20 countries are 5.8% (0.070 trillion USD) in 1991 and 8.3% (0.896 trillion USD) in 2019. The export share measured by using the OECD CLEG is relatively low compared to the other two classifications, but shows a similar gradually increasing trend.
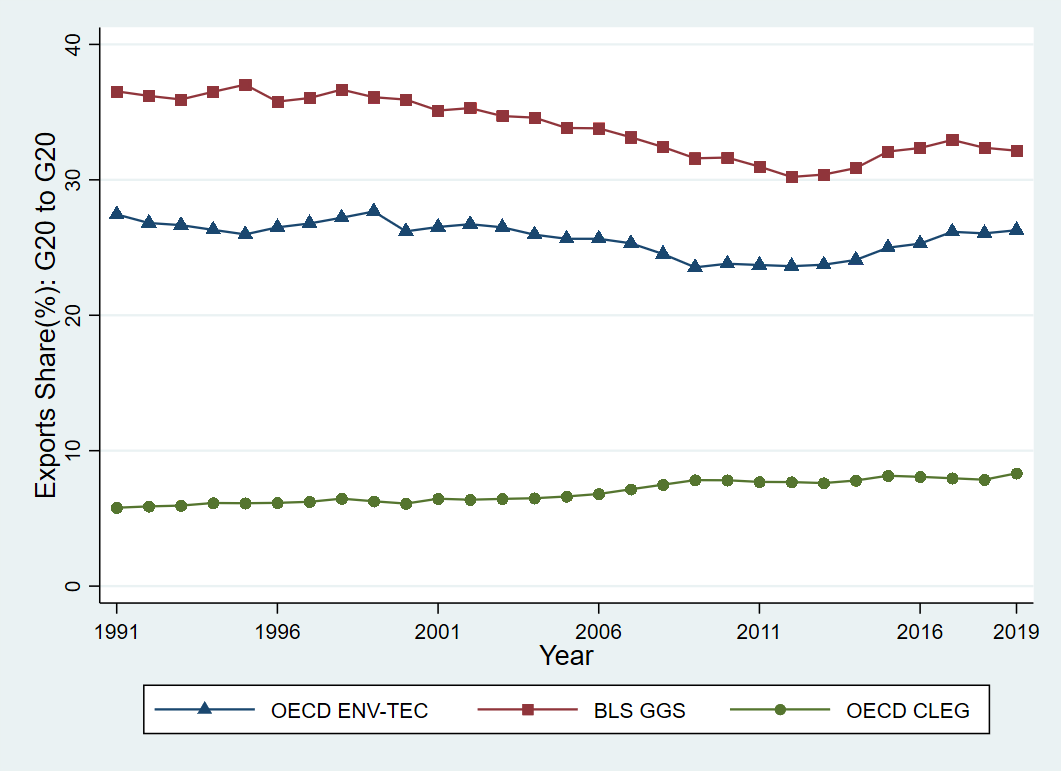
Figure 2: Trend of Green Exports Share from G20 to G20
And the OECD ENV-TECH and U.S. GGS shares from G20 to Non-G20 in Figure 3 show an increasing trend from 1991 to 1995 and 1996, respectively, but both shares decrease again until 2019. On the other hand, for the OECD CLEG, the share of green exports from G20 to Non-G20 increased about by 1.3%p from 5.9% (0.028 trillion USD) in 1991 to 7.2% (0.257 trillion USD) in 2019. Throughout the period, export share measured by the OECD CLEG tend to fluctuates more than other two classifications.
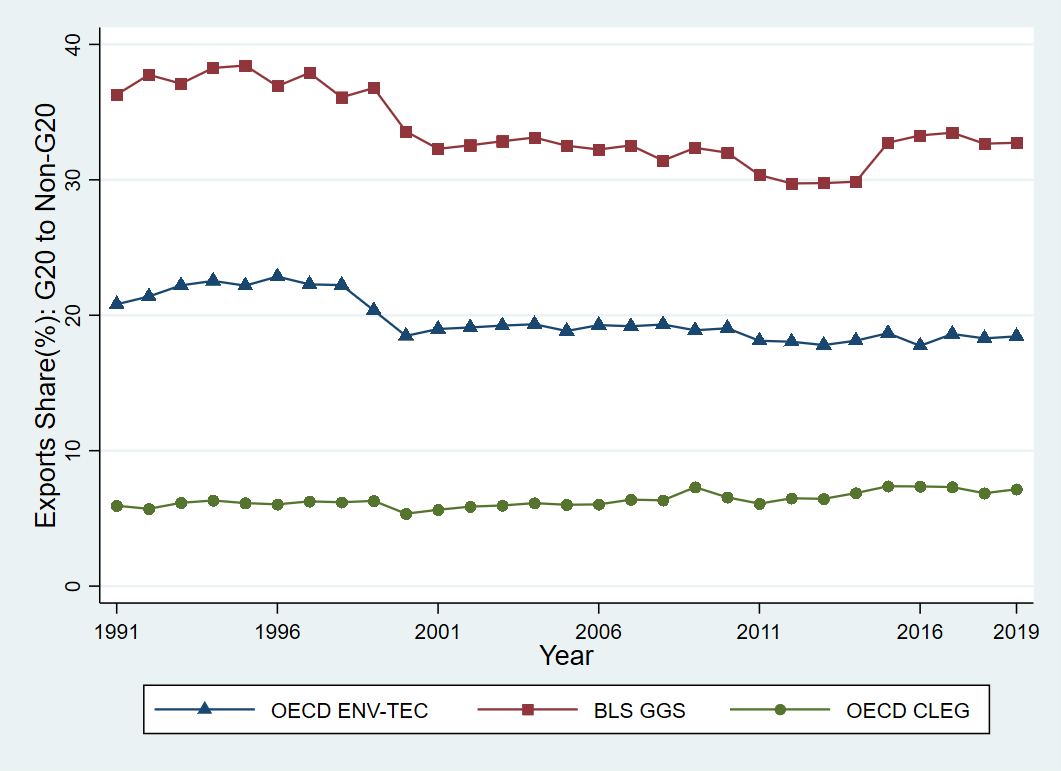
Figure 3: Trend of Green Exports Share from G20 to Non-G20
Figure 4 shows the shares of green exports from Non-G20 to G20. For OECD ENV-TECH, the green exports share in 1991 was 18.0% (0.028 trillion USD), but it decreased to 18.5% (0.474 trillion USD) in 2019 and recorded the lowest values of 15.7% (0.443 trillion USD) in 2012. The U.S. GGS exports share from Non-G20 to G20 show higher rate than the share of OECD ENV-TECH of about 33.4% until the late 1990s but decreased from 2000 and showed the lowest value in 2012 with 25.9% (0.729 trillion USD). Since then, it has increased again to 33.3% (0.854 trillion USD) in 2019. OECD CLEG show variability from 1991 to 2019, in overall, increasing by 0.6%p from 4.3% (0.007 trillion USD) in 1991 to 4.9% (0.125 trillion USD) in 2019, with recording the lowest export share in 1994 of 3.5% (0.015 trillion USD).
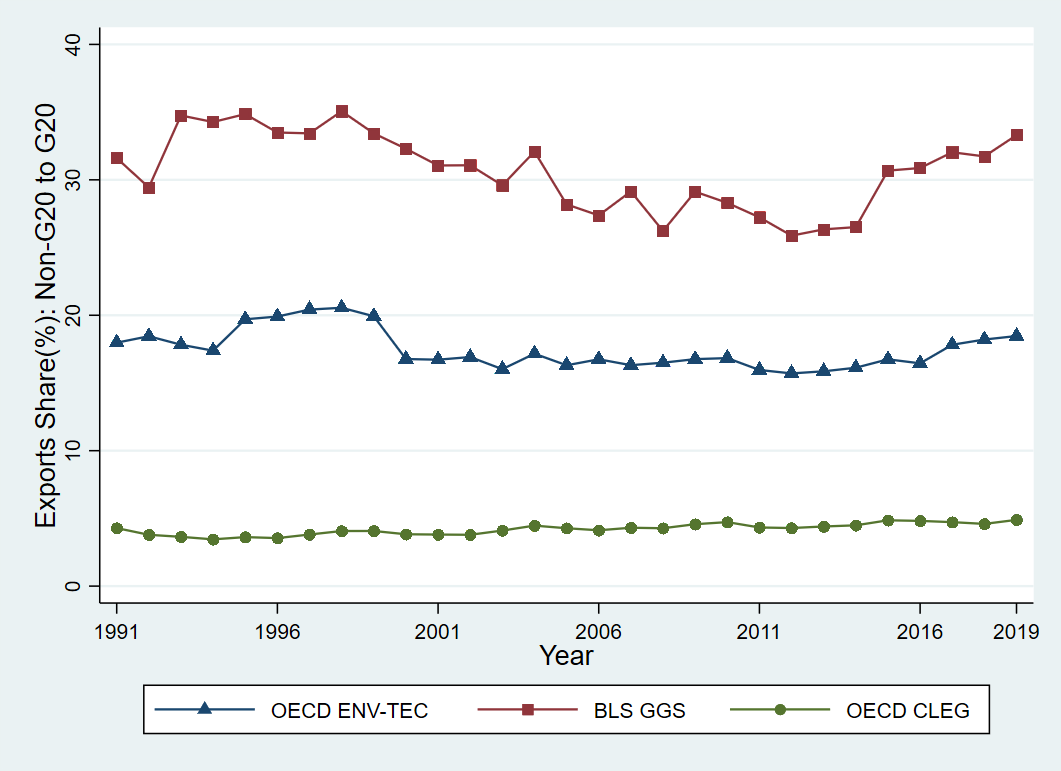
Figure 4: Trend of Green Exports Share from Non-G20 to G20
Figure 5 shows green exports share from Non-G20 to Non-G20 using the OECD ENV-TECH, BLS GGS, and OECD CLEG classifications from 1991 to 2019. Green exports share measured by these three classifications show similar trend throughout the period, decreasing until the 2010s and increasing thereafter. The green exports shares according to three classifications were 25.0% (0.019 trillion USD), 28.6% (0.022 trillion USD), and 4.0% (0.003 trillion USD), respectively, in 1991, and were estimated 11.9% (0.159 trillion USD), 28.4% (0.380 trillion USD) and 2.8% (0.037 trillion USD) in 2019, respectively.
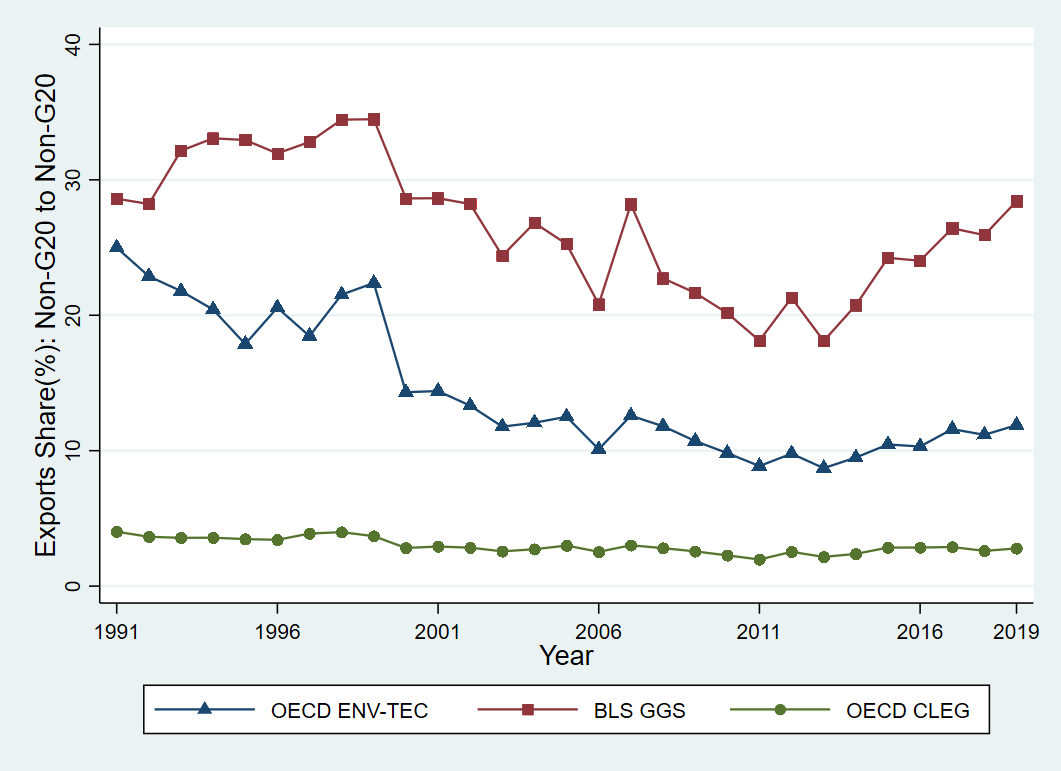
Figure 5: Trend of Green Exports Share from Non-G20 to Non-G20